
- Ethereum is trading near $2,553 after rebounding from $2,546, supported by a breakout from a descending wedge.
- Over $80 million in exchange outflows signals long-term accumulation, but the price must break above $2,570–$2,655 to confirm a broader rally..
Ethereum (ETH) is making waves once again as it nears the $2,570 resistance zone, riding a rising tide of positive technical indicators and significant exchange outflows. Here’s a breakdown of the key drivers behind the current market structure and what traders should be watching next.
Ethereum Price Recovers with Technical Support in Place
- Wedge breakout: After dipping near $2,546, ETH rebounded around $2,553, slicing through a descending wedge on shorter timeframes—an encouraging sign of renewed buying interest.
- Bullishly aligned indicators: The 30‑minute RSI has climbed to ~63.5, while a MACD crossover suggests strengthening momentum. On the 4‑hour chart, immediate resistance sits between the $2,555–$2,566 EMA cluster, with the price tomorrow brushing the upper Bollinger Band—signaling increasing volatility.
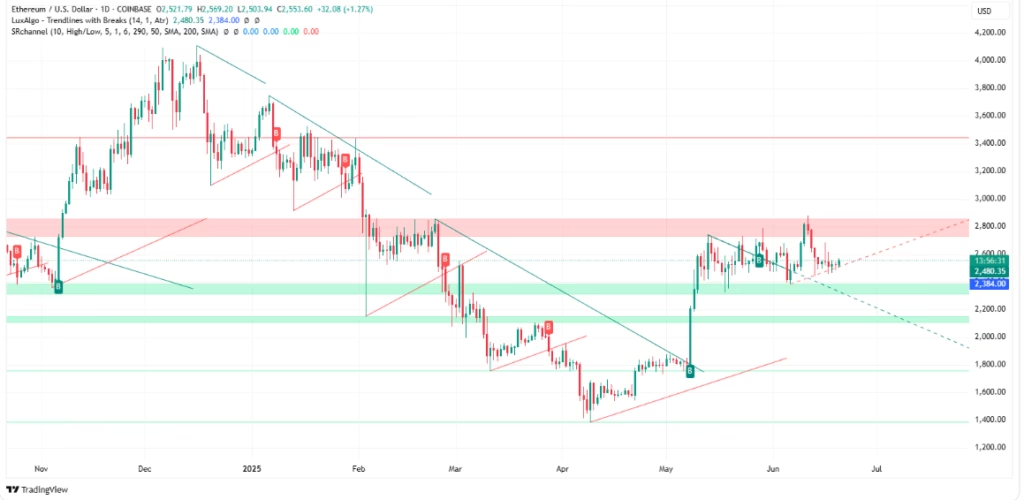
- Trend confirmation pending: A clean break above $2,570 could open the door to the $2,645–$2,670 region—last tested in early June. In contrast, failure to hold above $2,520–$2,480 may reintroduce bearish pressure targeting $2,384 and $2,300.
Ethereum Exchange Outflows Signal Accumulation
- Massive withdrawals: Over $80 million in net outflows from spot exchanges during the past 48 hours suggest long-term accumulation, likely by institutional or private investors moving ETH into self-custody .
- On-chain supply tightening: Similar trends recorded in past reports reveal exchange reserves at multi-year lows—just ~4.9% held on central platforms, after ~1 million ETH exited exchanges this past month. Shrinking supply creates fertile ground for prices to rise if buying interest continues.
Broader Context & Outlook
- Institutional interest rising: Weekly spot Ethereum ETF inflows reached about $583 million, while exchange reserves hit an all-time low (~18.57 million ETH), reinforcing the accumulation thesis.
- Longer-term momentum signals: A bullish “hidden divergence” in the 4-hour RSI, combined with rising futures open interest (+40% over 30 days), highlights growing trader optimism.
- Target zones ahead: A decisive break above $2,570–$2,655 could validate a daily symmetrical triangle breakout and put ETH on track toward $2,800–$2,900, or even $3,100–$3,600, according to Cointelegraph’s Gaussian Channel analysis. But stay vigilant—lack of follow-through may invite a retest of $2,520–$2,480.
Key Levels to Watch
| Level | Importance |
|---|---|
| $2,570 | Short-term resistance—breakout could trigger upside momentum |
| $2,655 | Daily channel resistance—needs clearing for stronger run |
| $2,479–$2,520 | Critical support—break here could reintroduce bearish bias |
| $2,800–$3,600 | Bullish targets if momentum holds and institutional flows persist |
Ethereum is showing signs of a bullish rebound: technical chart patterns are breaking out, major on-chain supply is tightening, and institutional backing is surging. The key now: whether ETH can sustain itself above $2,570, then tackle the $2,655 pivot. If so, a run to the $2,800+ zone—and possibly beyond—is within reach. Conversely, a breakdown below $2,520 could sap momentum and test lower support.
Trade strategies should align with these zones: consider scaling into long positions on confirmed breakouts, or looking at short/hedge strategies if those thresholds fail to hold.
DISCLAIMER:
The views and opinions expressed herein are solely those of the author or advertiser and do not necessarily reflect the views of the publisher. The publisher does not endorse or guarantee the accuracy of any information presented in this article. Readers are encouraged to conduct further research and consult additional sources before making any decisions based on the content provided.