Skip to content
Crypto News Focus logo CNF_CRYPTO_NEWS_FOCUS_LOGO 8

Crypto News Focus

your day to day crypto news site

Primary Menu
  • Home
  • News
    • Bitcoin News
    • Ripple XRP news
    • Ethereum News
    • Cardano News
    • Shiba Inu News
    • Pi Network News
    • More
  • Analysis
  • PR Desk
  • About Us
  • General Policy & Privacy
  • Guides
    • Bitcoin Guides
    • Pi Network Guide
    • Cardano Guide
  • Politics
  • Tech
  • Home
  • News
  • Analysts Split on XRP: Is a Rally To $3.35 Possible in July 2025?
  • Analysis
  • News

Analysts Split on XRP: Is a Rally To $3.35 Possible in July 2025?

vivian 3 July 2025
Ripple XRP
  • XRP is showing conflicting technical signals, with some analysts predicting a breakout to $3.35 based on bullish patterns.
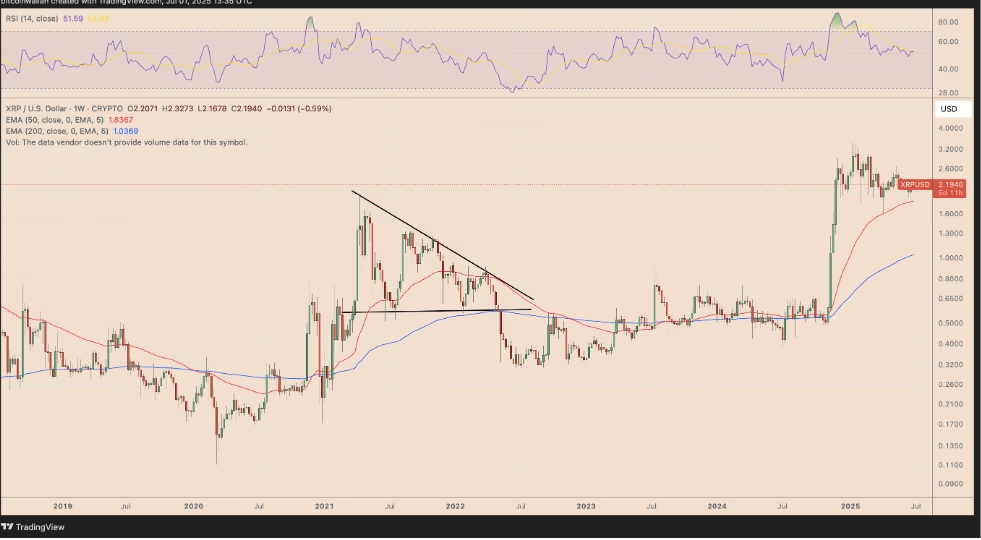
  • However, historical trends suggest descending triangles often lead to breakdowns, potentially pushing XRP down to $1.

Crypto traders are divided over XRP’s future, with some forecasting a major rally and others warning of a steep decline. While bullish voices see familiar breakout patterns, technical analysts caution that these same setups often lead to losses in today’s volatile market.

Bullish Analysts Spot Promising Chart Patterns

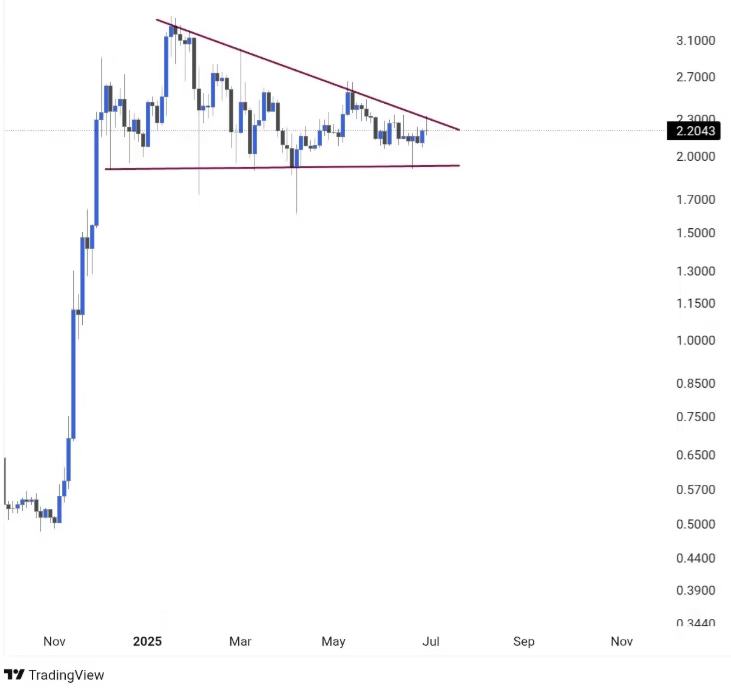
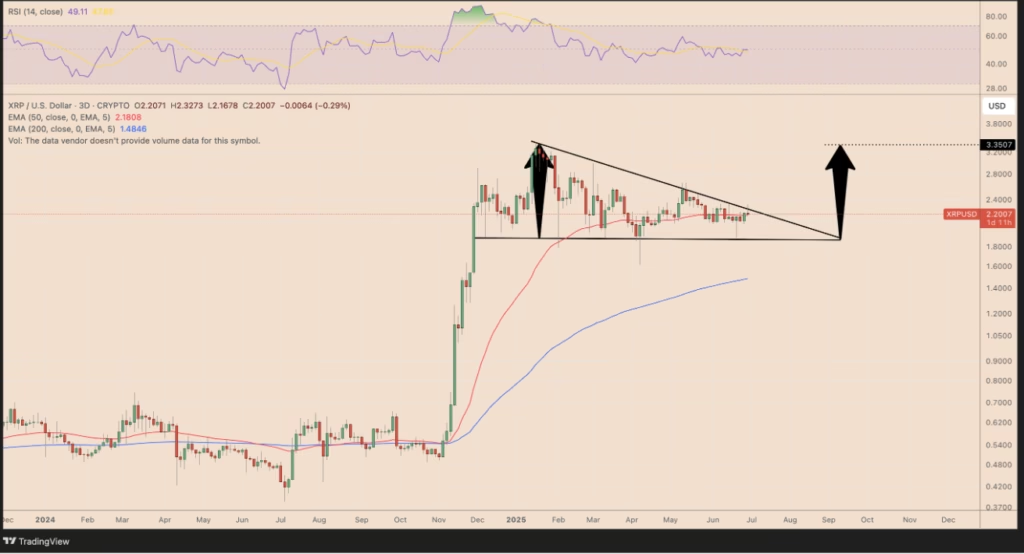
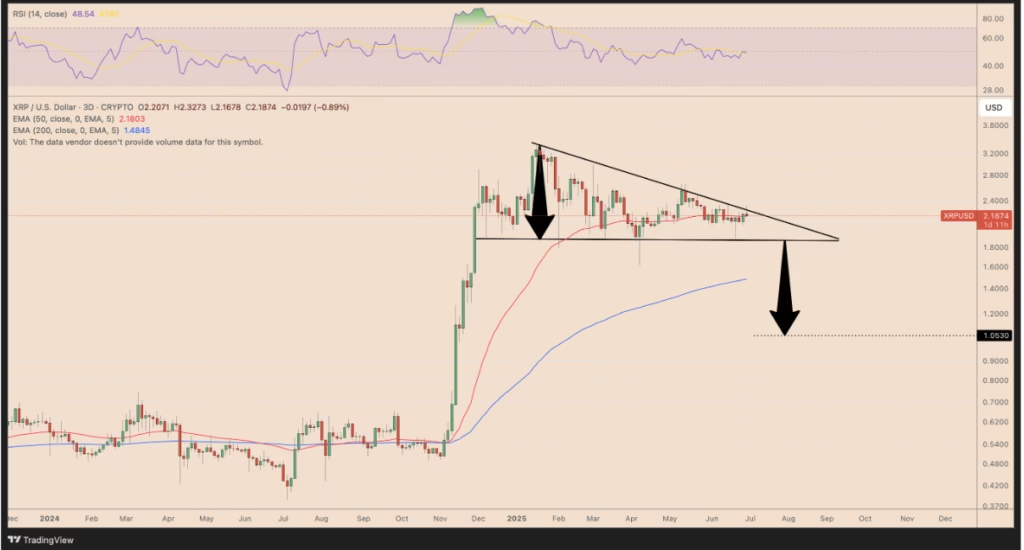
Crypto traders Mikybull Crypto and Gordon have both identified what they believe could be bullish technical formations on XRP’s charts. Mikybull describes XRP’s as “coiling up for a bigger move,” citing a descending triangle pattern.

XRP / USD PRICE CHART FOR  2 MONTHS PEROID
XRP/USD three-day price chart. Source: TradingView

Gordon, on the other hand, sees a falling wedge — typically a bullish reversal signal — and insists XRP is “looking primed to SEND.”

Gordon POST ON X
Source: Gordon

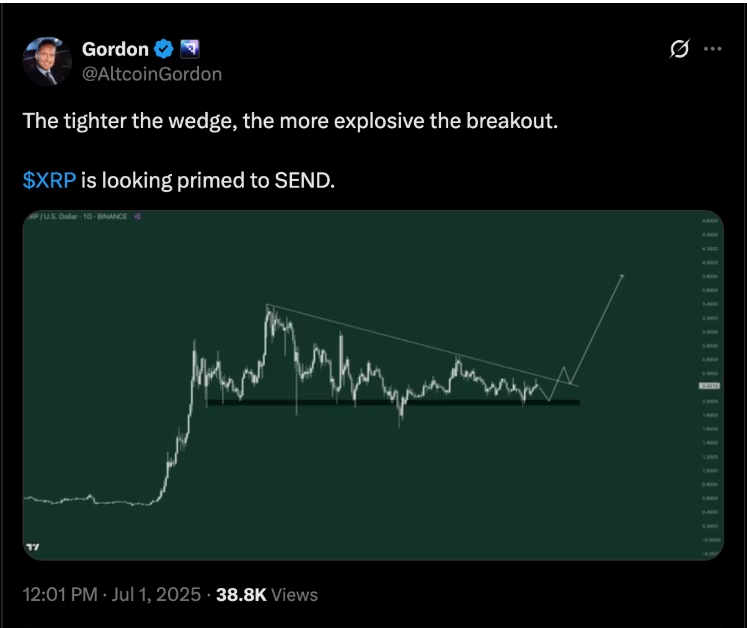
If their analysis proves correct, XRP could soon break out above the triangle’s upper trendline, with potential to rally as high as $3.35 — an increase of nearly 50% from its current levels.

XRP/ U.S DOLLAR PRICE CHART FOR 3 DAYS PERIOD
XRP/USD three-day price chart. Source: TradingView

Historical Patterns Suggest Bearish Outcome

Despite the optimism, historical data paints a more cautious picture. Researcher Thomas Bulkowski notes that descending triangles, especially those that follow uptrends, result in bearish breakdowns around 54% of the time. In the crypto market, that number could be even higher due to amplified volatility, with some studies estimating the breakdown rate between 60%–70%.

Revere Copper and Brass price performance 1946
Revere Copper and Brass price performance 1946: Source: Technical Analysis of Stock Trends

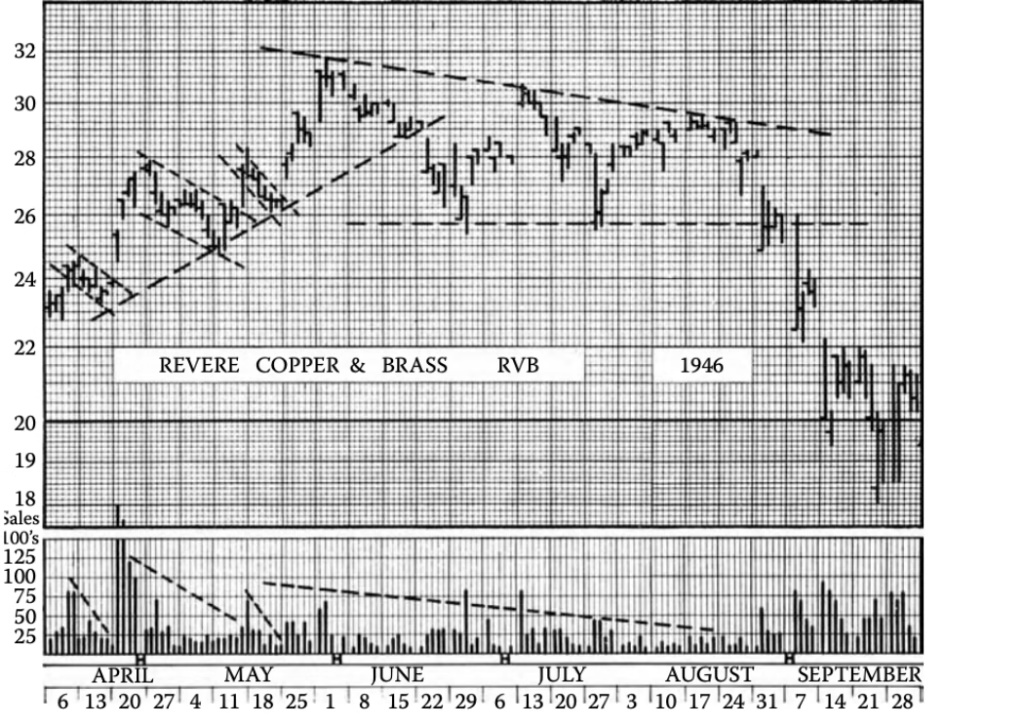
A key issue lies in mistaking descending triangles for falling wedges. While both slope downward, descending triangles typically feature a flat support base — a sign that selling pressure is increasing.

7 days price chart for XRP / U.S DOLLAR
XRP/USD weekly price chart. Source: TradingView

This is evident in XRP’s chart, where the support zone around $1.80–$2.00 has been tested repeatedly with minimal rebound.


XRP/USD PRICE CHART FOR 3 Days period
XRP/USD three-day price chart. Source: TradingView

XRP Faces a Make-or-Break Moment

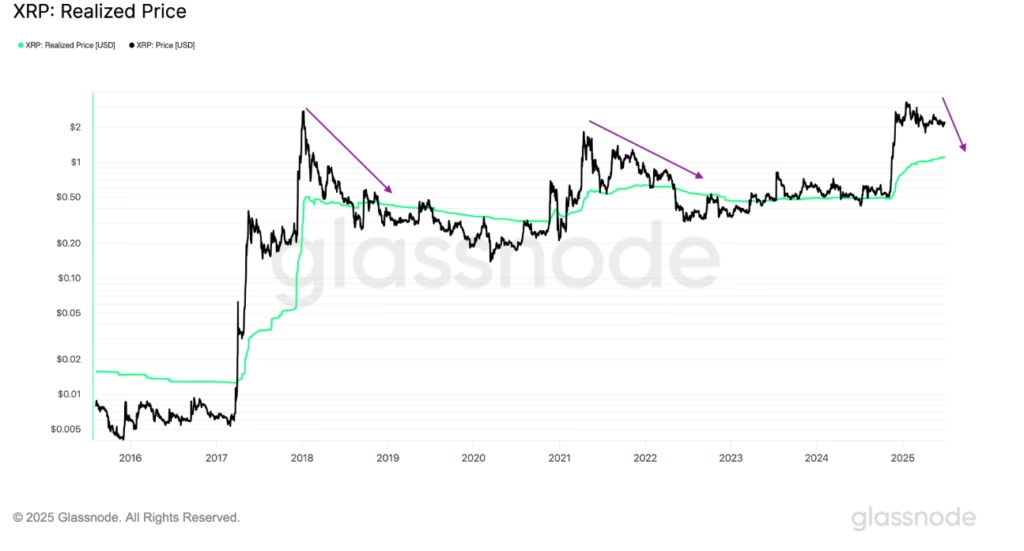
If XRP fails to hold above this critical support level, a drop toward $1 becomes a real possibility. That target aligns with XRP’s realized price — the average purchase price across all holders — adding weight to the bearish case.

XRP realized price FOR 365 DAYS PERIOD
XRP realized price. Source: Glassnode

While analysts don’t rule out a strong XRP’s rally in 2025, the road ahead remains uncertain. Traders should watch for a confirmed breakout or breakdown before placing bets, as the current formation could go either way.

ALSO READ:XRP Still Bullish Despite Sharp Rejection at $2.30

DISCLAIMER:
The views and opinions expressed herein are solely those of the author  and do not necessarily reflect the views of the publisher. The publisher does not endorse or guarantee the accuracy of any information presented in this article. Readers are encouraged to conduct further research and consult additional sources before making any decisions based on the content provided.

Continue Reading

Previous: Cardano Bears Hit Hard with $169K in Liquidations in Just 4 Hours
Next: How to Stake Solana (SOL) in 2025: Complete Beginner’s Guide

Related Stories

ONDO on $100B Market Projection black
  • Analysis

Can ONDO Break the $0.80 Barrier and Start a New Bull Run?

Sean Williams 3 July 2025
STELLAR XLM
  • Analysis

Can Stellar Hit $1 in 2025? Analysts Eye Breakout Above $0.252

Jane Kariuki 3 July 2025
Picture of Bitcoin and Ethereum coins
  • Analysis

Why Are Bitcoin, Ethereum, and XRP Going Up Today? July Rally Explained

Dennis Gatheca 3 July 2025

For general inquiries, please email us at Info@cryptonewsfocus.com

Crypto news focus is your day-to-day crypto news site. Get all the latest News and trends in the crypto, blockchain, and DeFi space. For more info and inquiries, reach out via email at info@cryptonewsfocus.com

You may have missed

ONDO on $100B Market Projection black
  • Analysis

Can ONDO Break the $0.80 Barrier and Start a New Bull Run?

Sean Williams 3 July 2025
STELLAR XLM
  • Analysis

Can Stellar Hit $1 in 2025? Analysts Eye Breakout Above $0.252

Jane Kariuki 3 July 2025
Picture of Bitcoin and Ethereum coins
  • Analysis

Why Are Bitcoin, Ethereum, and XRP Going Up Today? July Rally Explained

Dennis Gatheca 3 July 2025
Cardano coin image
  • Analysis

Cardano Set for Bull Run as Analyst Predicts $1.33 Target

vivian 3 July 2025

Social Media

Crypto News Focus © All rights reserved | MoreNews by AF themes.
Go to mobile version
We use cookies to ensure that we give you the best experience on our website. If you continue to use this site we will assume that you are happy with it.Ok