- Cardano’s price is experiencing a boost amid mysterious transactions involving millions of ADA, sparking speculation and interest in the market.
- Technical indicators suggest a bullish trend, with potential for ADA to reach new resistance levels if the upward momentum continues.
Cardano (ADA) is witnessing a surge in market activity due to a series of mysterious transactions involving millions of ADA. This recent flurry of activity has captured the attention of crypto enthusiasts and analysts alike, fueling speculation about the potential impact on ADA’s price trajectory.
Unraveling the Mystery of Massive ADA Transfers
Recently, a notable top Cardano wallet executed a large-scale transfer of ADA, which has left the crypto community intrigued. The transaction involved millions of ADA and occurred during a period of significant network congestion linked to the launch of a new platform, reminiscent of pumpdotfun.
The transaction sequence began when a user converted Solana (SOL) to ADA via SimpleSwap at 14:00 UTC. This ADA was then sent to a new wallet created through GeroWallet, which subsequently transferred the ADA to another new wallet, Vespr. Although the transfer faced a temporary delay, it was eventually completed. Remarkably, a substantial amount of ADA from a high-activity wallet was later returned to the original wallet and subsequently sent back to Solana.
— laurence (@functi0nZer0) September 8, 2024
Price Trends and Market Sentiment
Amidst these mysterious transactions, Cardano’s price has shown a subtle yet noticeable increase. Over the past 24 hours, ADA has hovered above the $0.34 mark, with the current trading price standing at $0.3408—an uptick of 1.32% during U.S. market hours. This rise in price is accompanied by a significant boost in trading volumes, which have surged by 24.12% to $288.05 million. Open interest has also climbed by 2.06%, reaching $179.52 million. These indicators suggest growing investor confidence and heightened market interest in ADA.
Technical Indicators and Future Prospects
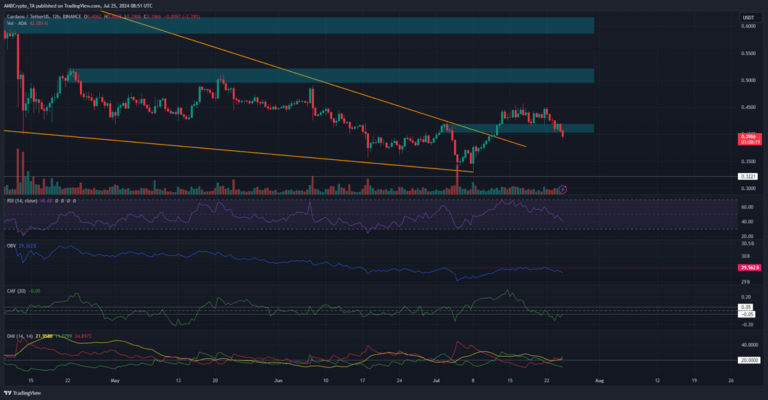
Analyzing ADA’s technical indicators reveals a bullish trend. The Relative Strength Index (RSI) is currently at 62, suggesting a neutral trend. The Moving Average Convergence Divergence (MACD) further supports the bullish outlook, with the MACD line positioned above the signal line and increasing green bars on the histogram indicating stronger upward momentum.
As Cardano’s price continues its upward trajectory, breaking through the $0.35 resistance level could signal a trend reversal. Should this happen, ADA might approach the next significant resistance level at $0.4. If the bullish momentum persists, ADA could potentially surge to $1 in the near future.
The recent mysterious wallet transactions have added an element of intrigue to Cardano’s market dynamics. With rising trading volumes and bullish technical indicators, ADA’s price could experience notable movements in the near term. Investors and traders should remain vigilant, as the current volatility and heightened interest might herald significant changes in Cardano’s price landscape.