- Toncoin (TON) has rebounded 15% from its September 6 low, reflecting broader market gains amid speculation about the Federal Reserve’s interest rate decisions.
- However, a cup-and-handle pattern breakdown suggests potential further declines, with a possible drop to $3.60 by October if key resistance levels are not reclaimed.
Toncoin (TON) has shown impressive resilience, rebounding 15% from its September 6 low. This recovery aligns with global stock market gains amid ongoing speculations about future Federal Reserve (Fed) interest rate decisions. Despite this positive movement, a critical technical pattern on TON’s daily chart suggests the potential for further downside unless key resistance levels are reclaimed.
Recovery Amidst Global Market Movements
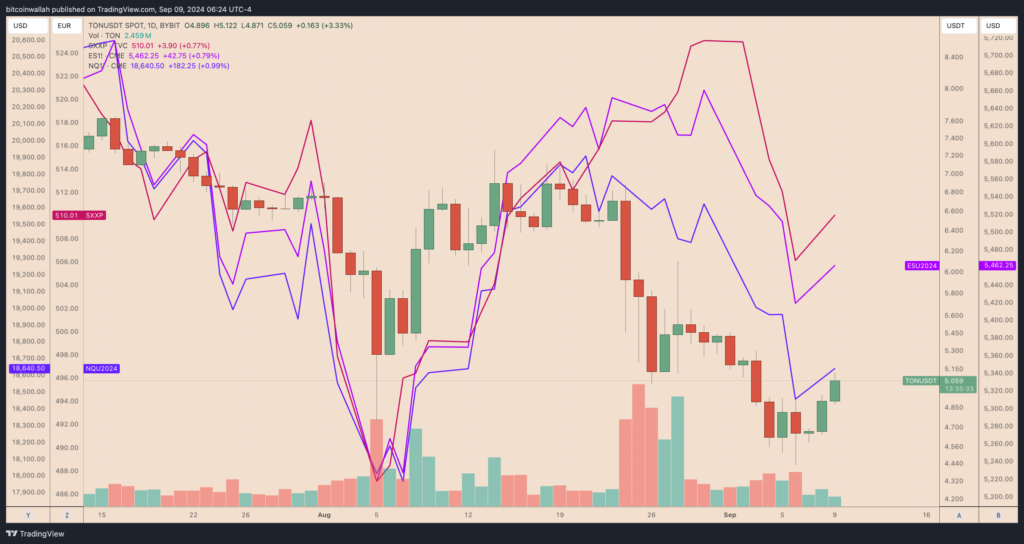
On September 9, Toncoin’s price surged by over 3.5%, reaching $5.12, which marks a substantial recovery from its recent low of $4.45. This rebound reflects broader market trends, as riskier assets, including global stock indices such as the Stoxx Europe 600 and U.S. futures for the S&P 500 and Nasdaq 100, also saw gains. These stock markets had previously slumped alongside the cryptocurrency sector due to weaker-than-expected U.S. payroll numbers on September 6.
The Fed’s next move is a major focal point for investors. With the U.S. job data sparking debates about the future interest rate path, speculation has intensified about whether the Fed will adopt a gradual or more aggressive approach to rate cuts. The upcoming U.S. inflation report, due on September 11, is expected to provide further insights into the Fed’s potential decisions.
Louis Kuijs, Asia-Pacific Chief Economist at S&P Global, highlighted in an interview with Bloomberg Television that a September rate cut is almost certain, but the real concern is the number and magnitude of future cuts. With traders increasingly betting on a 50 basis-point rate cut this month, Toncoin and other risk assets have seen a notable recovery.
Technical Breakdown: Cup-and-Handle Pattern
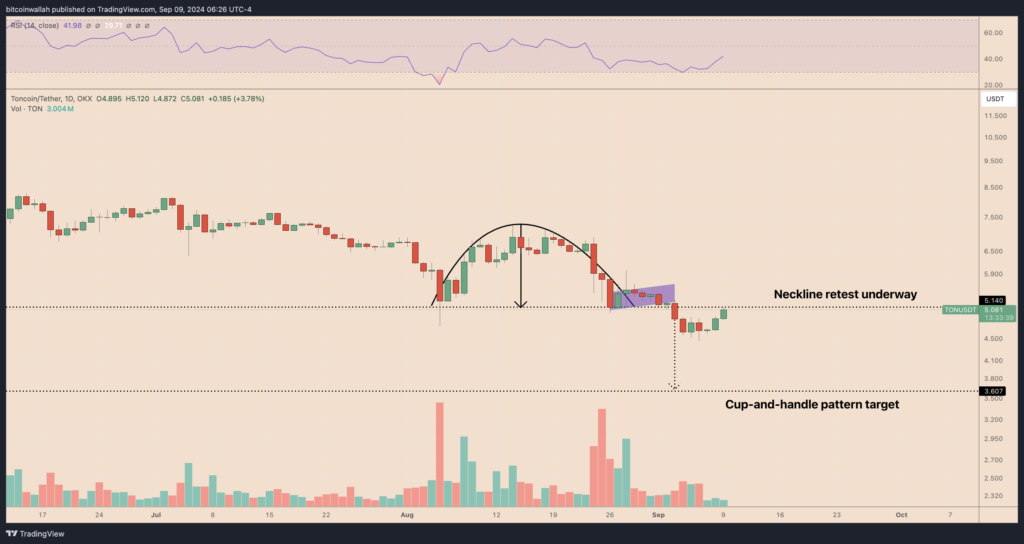
Despite the recent recovery, Toncoin’s technical indicators suggest caution. The cryptocurrency’s daily chart reveals a cup-and-handle pattern breakdown. This classic technical pattern, characterized by a rounded top (the cup) followed by a consolidation period (the handle), has recently triggered a bearish signal.
As of September 9, Toncoin was trading below the key neckline of this pattern, indicating that it has entered a bearish phase. The price action currently shows a retest of this neckline, which now acts as resistance. In technical analysis, such retests are often seen as confirmation of a bearish trend, suggesting further declines unless TON reclaims and sustains levels above the neckline.
Future Price Outlook
If the bearish trend continues, Toncoin could see its price drop to $3.60 by October, representing a 30% decline from current levels. Investors should monitor key resistance levels and broader market trends closely, as these factors will significantly influence Toncoin’s short-term performance.