



- Bitcoin has rebounded from early-January lows, with long-term holders selling less and technical charts signaling strength.
- Combined with bearish social sentiment, these factors increase the likelihood of BTC reaching $100,000 soon.
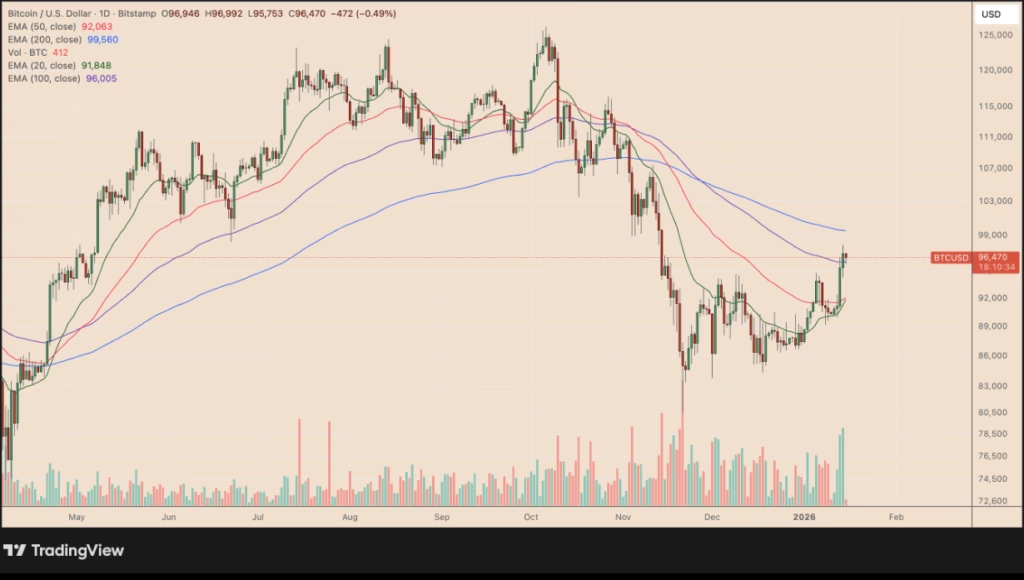
Bitcoin (BTC) has rebounded after briefly dipping below $90,000 earlier this month, reclaiming around $95,000 by January 15. BTC’s latest price action, combined with key on-chain and technical indicators, suggests the road to $100,000 may be closer than skeptics anticipate.

OG Bitcoin Holders Are Selling Less
One of the most telling signs comes from the activity of “OG” Bitcoin holders, those holding coins for over five years. Data from CryptoQuant shows that spent transaction outputs (STXO) from these long-term holders have fallen sharply from around 2,300 BTC to roughly 1,000 BTC.
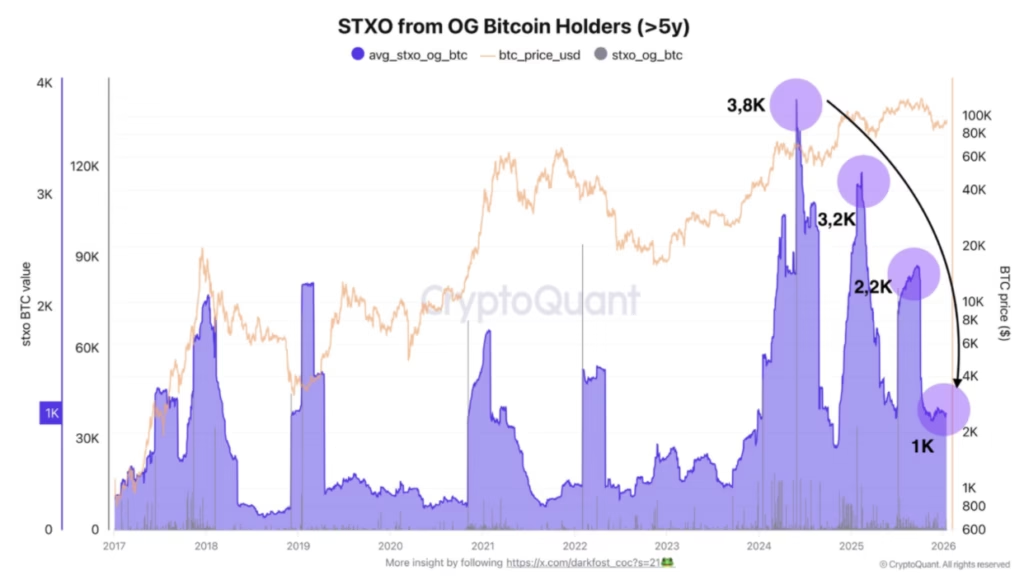
Historically, reduced selling by long-term holders signals that these investors expect higher prices ahead. While OGs typically offload aggressively near cycle tops, the current slowdown suggests that major holders are increasingly choosing to hold rather than sell, creating a bullish backdrop for continued price appreciation.
Bearish Sentiment Could Be a Positive Signal
Social sentiment data from Santiment shows growing bearishness in Bitcoin commentary across major platforms. Even as BTC climbs, the market’s sentiment remains bearish, indicating that retail traders and short-term participants are still skeptical.

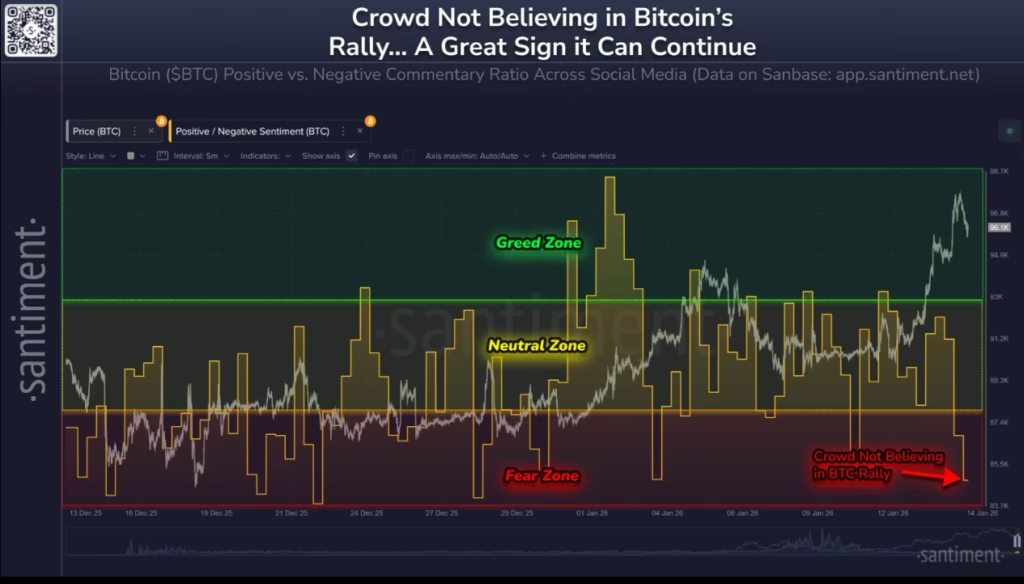
Ironically, this could be bullish. Bitcoin often moves against prevailing sentiment, particularly during trend reversals. Persistent doubt means less selling pressure from uninformed holders and a higher likelihood of continuation moves. For now, the psychological $100,000 mark looms as a near-term target.
Technical Structure Points to a Breakout
From a charting perspective, Bitcoin has formed an ascending triangle pattern near recent lows, characterized by rising support and flat resistance. This structure indicates growing buying pressure, with sellers unable to push prices lower.

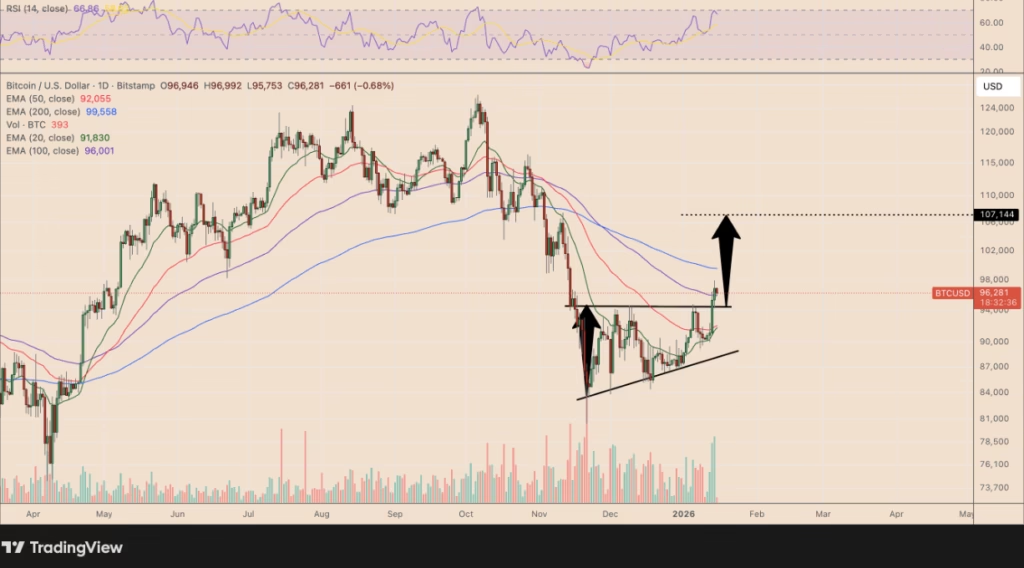
BTC’s breakout above the triangle’s upper boundary signals potential for a retest of the $100,000–$107,000 zone. This aligns with prior resistance levels and key psychological milestones, reinforcing the bullish narrative suggested by on-chain and sentiment data.
Combining reduced OG selling, bearish social sentiment, and an ascending triangle breakout, Bitcoin appears well-positioned for a continued upward trajectory. While market volatility remains, these three independent indicators collectively point toward higher odds of BTC challenging the $100,000 mark in the near term.
ALSO READ: Why Pi Network Is Struggling While Crypto Markets Surge
DISCLAIMER:
The views and opinions expressed herein are solely those of the author and do not necessarily reflect the views of the publisher. The publisher does not endorse or guarantee the accuracy of any information presented in this article. Readers are encouraged to conduct further research and consult additional sources before making any decisions based on the content provided.