


- Bitcoin is entering the seventh week of its uptrend, making a short-term correction likely.
- Despite this, historical patterns suggest BTC could hit new all-time highs by Q4.
Bitcoin’s bullish streak may be approaching a critical juncture as the cryptocurrency begins the seventh week of its latest “price discovery uptrend.” After six consecutive weeks of gains, analysts are warning that a correction could be imminent, following historical patterns observed in previous halving cycles.
Price Discovery Correction Looms
According to trader and analyst Rekt Capital, Bitcoin’s second price discovery uptrend since the 2024 halving is nearing its expected end. Historically, BTC’s uptrends in these cycles tend to last between five and seven weeks. The seventh week—set to begin Monday—marks a key moment where a pause or correction is statistically likely.

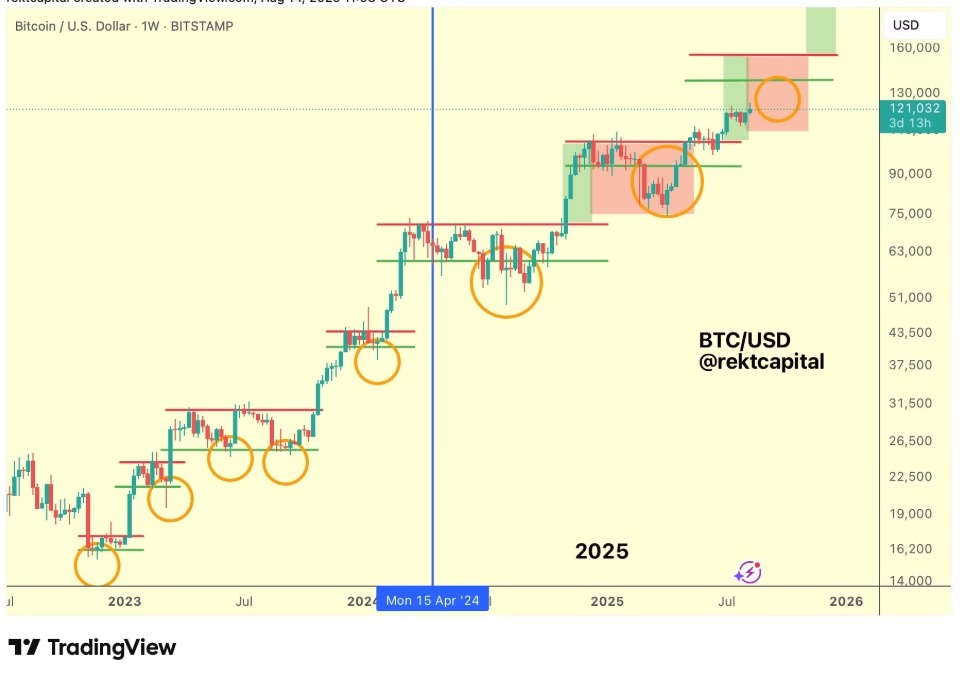
Bitcoin’s most recent all-time high reached $124,500, but the price has stalled below the $120,000 mark. If history repeats, a short-term dip could occur, similar to past halving cycles. Previous corrections saw BTC retrace as much as 30%, such as the drop from nearly $110,000 to under $75,000 earlier in 2025.
Bitcoin Historical Patterns Suggest Timing of Dip
Data shows that in past cycles, Bitcoin’s price discovery corrections have typically started between weeks six and eight of an uptrend. For instance, Week 7 corrections were seen in 2013 and 2025, while 2017 experienced a Week 8 dip. Such cycles illustrate that temporary pullbacks are normal, setting the stage for subsequent rallies.
Bitcoin Q4 Rally Remains Possible
Despite a potential short-term correction, traders remain optimistic about Bitcoin’s long-term trajectory. Analyst Daan Crypto Trades noted that dips in the next one to two months could serve as a prelude to a strong fourth-quarter rally. Historical trends indicate that after a corrective phase, BTC often experiences explosive gains toward the end of the year, potentially establishing fresh all-time highs.
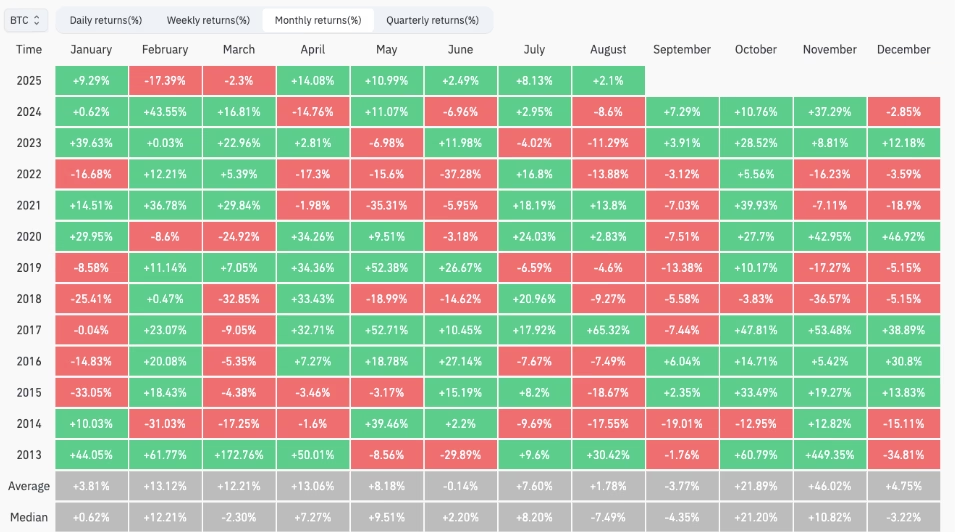
August has already seen Bitcoin rise 2.1%, slightly above the monthly average of 1.8%, while September has historically been weaker, averaging a 3.8% drawdown. This further suggests that a correction may not only be likely but also necessary to sustain a larger upward cycle.

In conclusion, Bitcoin’s seventh week of its price discovery uptrend could mark the beginning of a short-term correction. However, historical data and market patterns indicate that such a dip may ultimately pave the way for renewed strength and potentially record-breaking highs by year-end.
ALSO READ:Pi Network Price Set for Major Rally as Bullish Signs Strengthen
DISCLAIMER:
The views and opinions expressed herein are solely those of the author and do not necessarily reflect the views of the publisher. The publisher does not endorse or guarantee the accuracy of any information presented in this article. Readers are encouraged to conduct further research and consult additional sources before making any decisions based on the content provided.