



- Bitcoin rose to a three-week high as easing tensions and falling oil prices boosted investor confidence.
- A bullish ascending triangle pattern suggests further upside, with $74,500 as the key resistance level.
Bitcoin has returned to the spotlight after posting a strong rebound, with market conditions aligning in favor of further gains. A mix of improving global sentiment and bullish technical patterns is now shaping expectations for the next move.
Bitcoin Climbs as Geopolitical Tensions Ease
Bitcoin surged 6.7% to reach a three-week high of $72,379, briefly pushing above the key $72,000 level before settling slightly lower. The rally followed signs of de-escalation in tensions between the United States and Iran, which helped restore confidence across global markets.
A two-week pause in hostilities played a major role in calming investors. As a result, demand for risk assets increased, lifting not only Bitcoin but also the broader crypto market. Ethereum moved back above $2,200, while major altcoins also posted gains.
At the same time, oil prices dropped sharply, with crude falling below $100. This decline reduced fears of rising inflation, creating a favorable environment for both crypto and traditional markets. Stocks and commodities also reacted positively, reflecting a wider recovery in investor sentiment.
Falling Oil Prices Boost Risk Appetite
The decline in oil prices marked a turning point for markets that had been under pressure due to supply disruptions. With key shipping routes reopening, concerns over global supply eased significantly.
Lower oil prices often reduce inflation expectations, which tends to benefit assets like Bitcoin. As inflation fears cooled, capital flowed back into riskier investments. This shift helped push the total crypto market capitalization back above $2.5 trillion.
The broader market rally extended beyond crypto. Major stock indices and precious metals also recorded gains, showing that investor confidence was returning across multiple sectors.
Bitcoin Forms Ascending Triangle Pattern
From a technical perspective, Bitcoin is showing signs of a potential breakout. The price is currently forming an ascending triangle pattern on the daily chart, which is widely considered a bullish continuation setup.

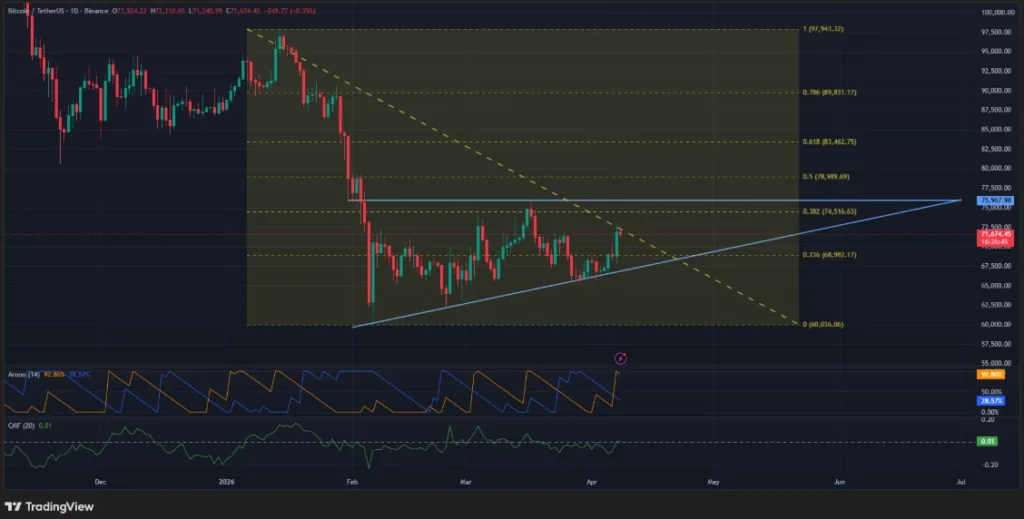
This pattern usually appears during a consolidation phase before a strong upward move. It is defined by a horizontal resistance level and a rising trendline, indicating that buyers are gradually gaining control.
Indicators are supporting this outlook. The Aroon Up indicator remains high, suggesting sustained buying pressure. Meanwhile, the Chaikin Money Flow has turned positive, signaling that fresh capital is entering the market.
Key Levels to Watch in the Short Term
Bitcoin now faces a crucial resistance level at $74,500. A successful break above this zone could open the door for a move toward $76,000, which aligns with the expected breakout level of the triangle pattern.
If bullish pressure remains strong, the next major target sits near $80,000. However, this outlook depends on Bitcoin maintaining its current structure.
On the downside, a drop below $69,000 could weaken the bullish setup and signal a potential shift in trend.
ALSO READ: IOTA Launches Digital Highway to Modernize Global Trade
DISCLAIMER:
The views and opinions expressed herein are solely those of the author and do not necessarily reflect the views of the publisher. The publisher does not endorse or guarantee the accuracy of any information presented in this article. Readers are encouraged to conduct further research and consult additional sources before making any decisions based on the content provided.