



- Bitcoin shows a short-term rebound as selling pressure eases, supported by RSI signals and lower on-chain activity.
- However, ETF outflows, profit-taking, and key resistance levels near $90,550 keep the risk of a drop toward $78,000 alive.
Bitcoin (BTC) has shown signs of a short-term rebound after days of heavy selling, but technical risks remain that could push the price toward $78,000. Traders and analysts are closely watching several critical levels to determine whether this bounce can gain momentum or stall.
Selling Pressure Shows Signs of Easing
Recent technical signals indicate that BTC sellers may be tiring. On January 25, Bitcoin briefly tested the $86,100 neckline of a daily head-and-shoulders pattern, a formation often signaling bearish reversals. Instead of breaking down, BTC rebounded, supported by a hidden bullish divergence between price and the Relative Strength Index (RSI).

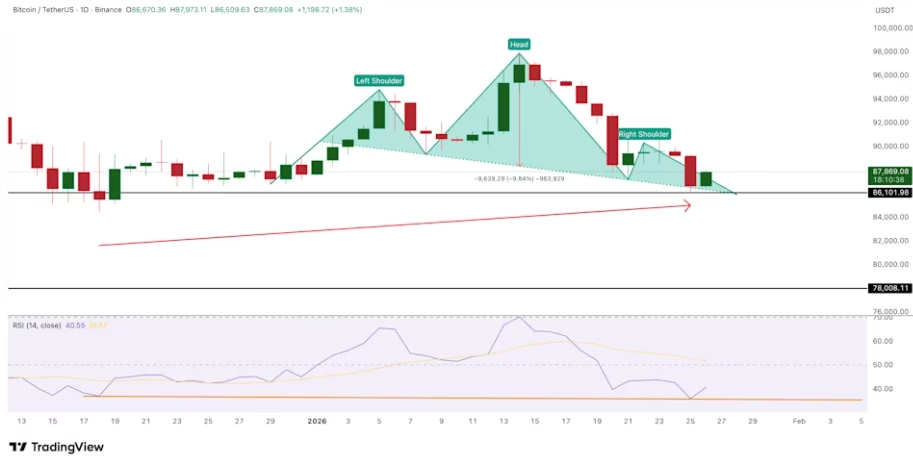
Between December 18 and January 25, Bitcoin’s price formed a higher low while RSI recorded a lower low. This suggests that although momentum weakened, selling pressure was slowing, a setup that typically leads to short-term rebounds.
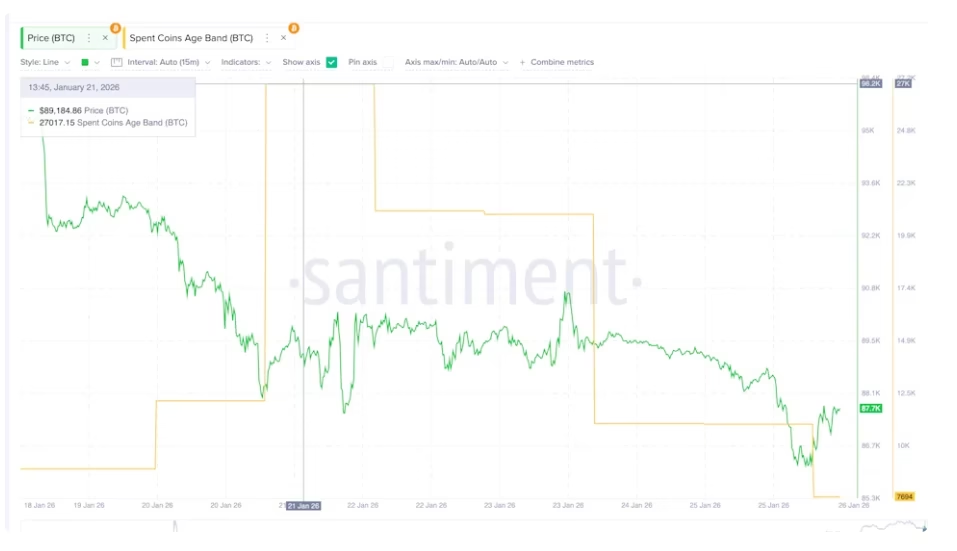
On-chain data confirms this trend. The Spent Coins Age Band, which measures how many coins of various holding ages are moved, dropped from roughly 27,000 to about 7,690, a 72% decline. Lower coin movement indicates that holders are stepping back from selling, reinforcing the potential for a rebound.

ETF Outflows and Profit-Taking Pose Risks
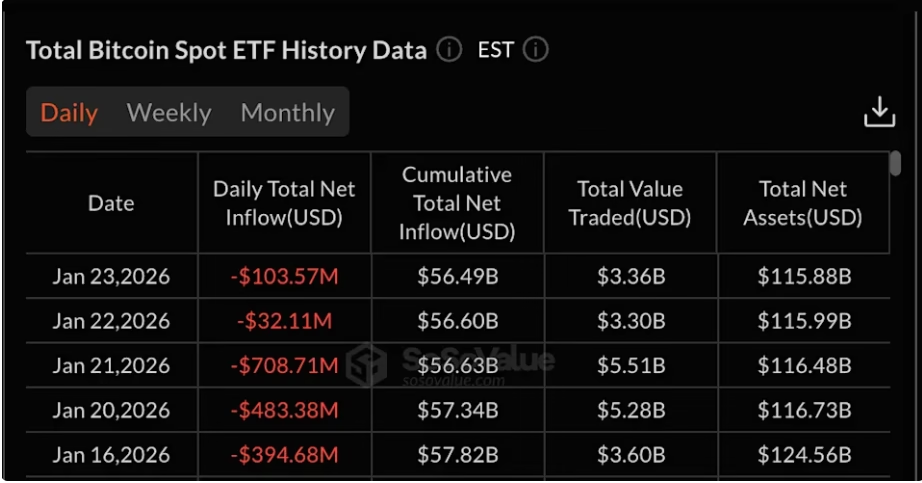
Despite easing sell pressure, BTC’s rebound is not guaranteed. Bitcoin spot ETFs have experienced multiple consecutive daily outflows, signaling weak institutional demand. Historically, rebounds without ETF support struggle to sustain momentum.

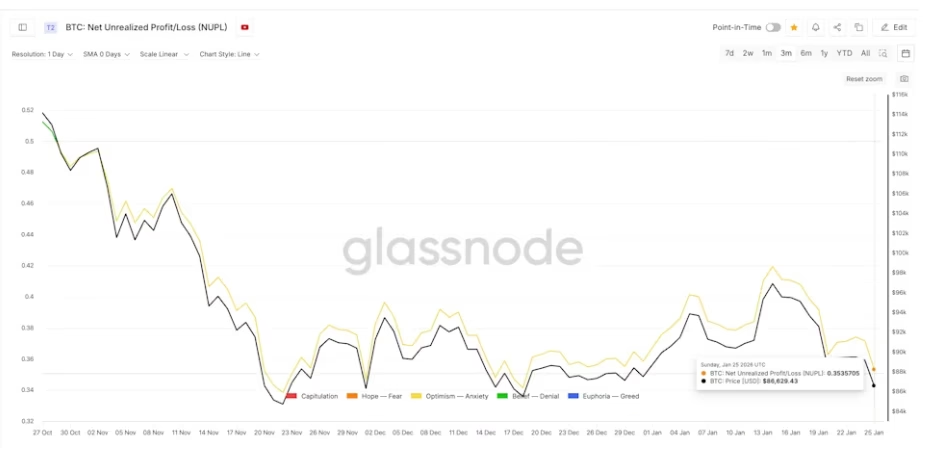
Additionally, profit-taking could weigh on BTC. The Net Unrealized Profit/Loss (NUPL) metric, currently near 0.35, indicates that many holders are still in profit. Local bottoms in late November and mid-December occurred when NUPL fell closer to 0.33–0.34, suggesting some selling pressure remains before a durable bottom forms.

Cost-Basis Levels Highlight Resistance Zones
Further resistance comes from cost-basis walls, price levels where large amounts of BTC were previously acquired. The most significant barrier lies between $90,168 and $90,591, with a cluster around $90,550. Surpassing this zone would open the path to the next key level at $91,210, which, if reclaimed, would weaken the head-and-shoulders pattern.

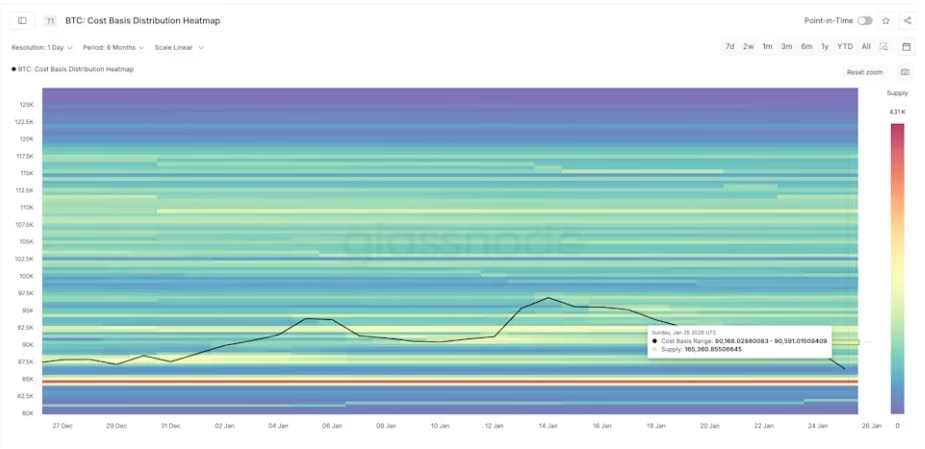
However, the broader structure remains vulnerable until Bitcoin breaks above $97,930. On the downside, a daily close below $86,100–$85,900 would confirm a breakdown, potentially sending BTC toward the $78,000 target—a 10% drop from the neckline and over 11% from the current price.

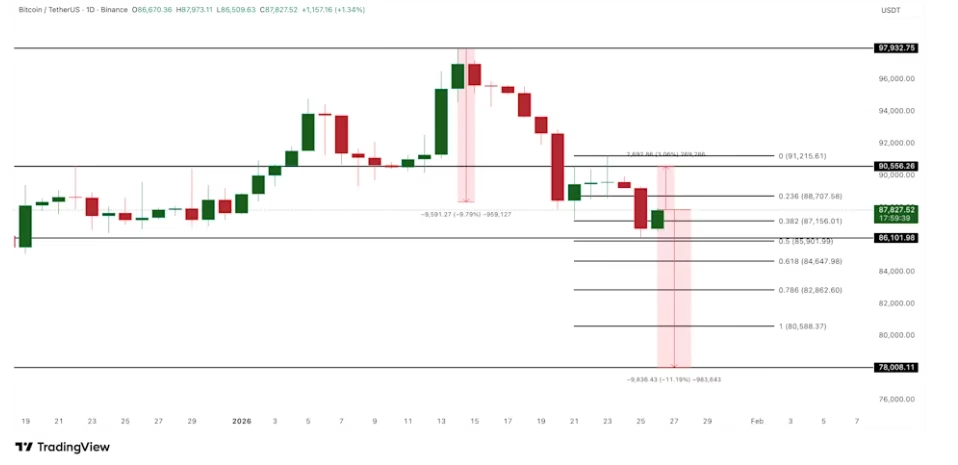
Bitcoin’s short-term rebound shows promise as selling pressure eases, but ETF outflows, profit-taking, and major resistance levels leave the broader trend uncertain. Traders should monitor $86,100, $90,550, and $97,930 closely to gauge whether BTC can sustain a recovery or resume its slide.
ALSO READ: Pi Network Launches No-Code Payments and Pi Credit Rewards for Creators
DISCLAIMER:
The views and opinions expressed herein are solely those of the author and do not necessarily reflect the views of the publisher. The publisher does not endorse or guarantee the accuracy of any information presented in this article. Readers are encouraged to conduct further research and consult additional sources before making any decisions based on the content provided.