



- Bitcoin faces continued pressure as $1.28 billion in weekly ETF outflows and stronger US jobs data weaken investor demand.
- BTC risks falling toward $70,000 unless it reclaims the $75,222 resistance level.
Bitcoin (BTC) extended its losing streak to five consecutive weeks, trading below the 50-week moving average near $75,222. Weak ETF demand and stronger-than-expected US jobs data have increased the risk of further price declines.
US spot Bitcoin ETFs recorded $1.28 billion in net outflows last week, their largest weekly withdrawal since late June. Meanwhile, rising expectations of a December Fed rate hike have added pressure on Bitcoin as investors reassess exposure to riskier assets.
Bitcoin ETF Outflows Hit Highest Level Since June
Institutional demand for Bitcoin weakened further last week as US spot Bitcoin ETFs recorded $1.28 billion in net outflows, according to SoSoValue data.

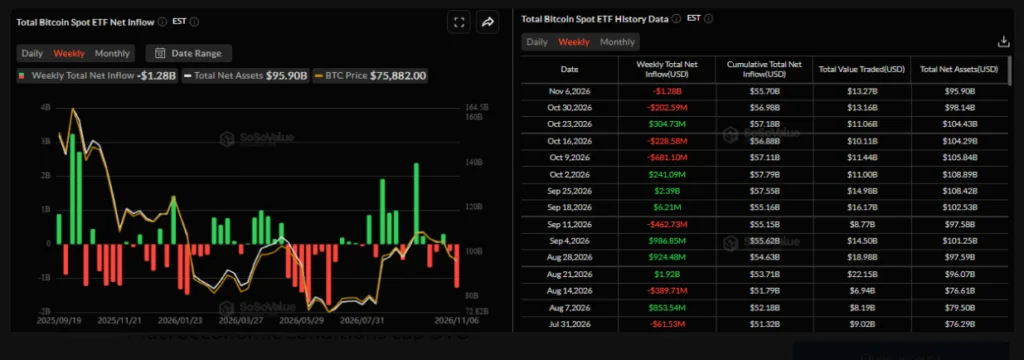
This marked the second consecutive week of withdrawals and the largest weekly outflow since the end of June. The trend suggests investors are becoming more cautious about Bitcoin’s near-term prospects.
Continued withdrawals could create additional selling pressure, particularly if institutional demand fails to recover. Another week of heavy outflows could make it harder for BTC to reclaim lost support levels.
Strong US Jobs Data Adds Pressure on Bitcoin
Macroeconomic conditions have also weakened Bitcoin’s recovery prospects.
Stronger-than-expected US Nonfarm Payrolls data reinforced expectations that the Federal Reserve could keep interest rates higher for longer. Following the jobs report, market expectations of a December rate hike increased to 80.5%, up from 72.8%.

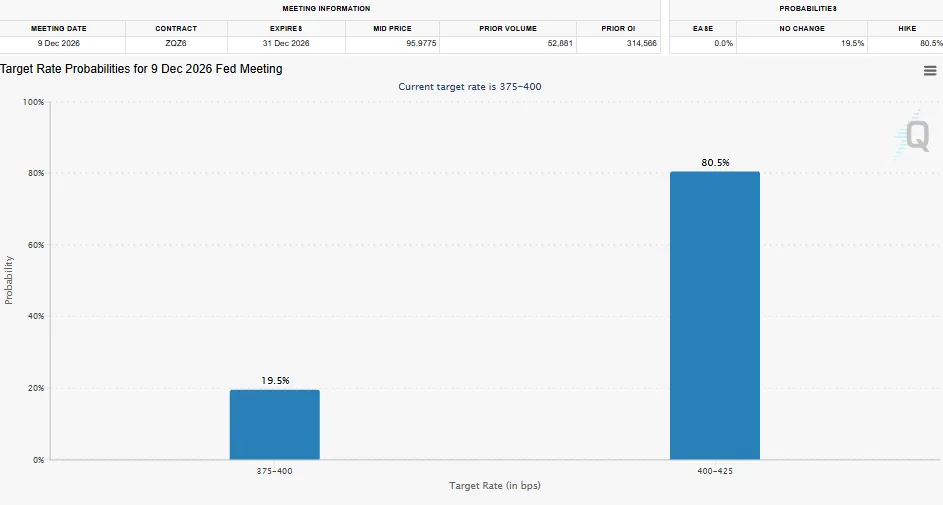
Higher interest rates can reduce demand for Bitcoin because investors may prefer assets offering returns. They can also tighten financial conditions and limit investment in riskier markets.
This creates another challenge for BTC as it attempts to recover from its recent losses.
Bitcoin Price Forecast: $70,000 Support Comes Into Focus
Bitcoin lost 4.47% last week and closed below its 50-week Simple Moving Average (SMA) at $75,222. This extended its losing streak to five consecutive weeks.
At the start of Monday’s session, BTC continued trading below this level, with the 50-week SMA near $74,984 acting as immediate resistance.
On the weekly chart, the RSI stands at 48, below the neutral 50 mark. This points to weakening bullish momentum. The MACD histogram remains positive, but its shrinking bars suggest that upward Strength is fading.

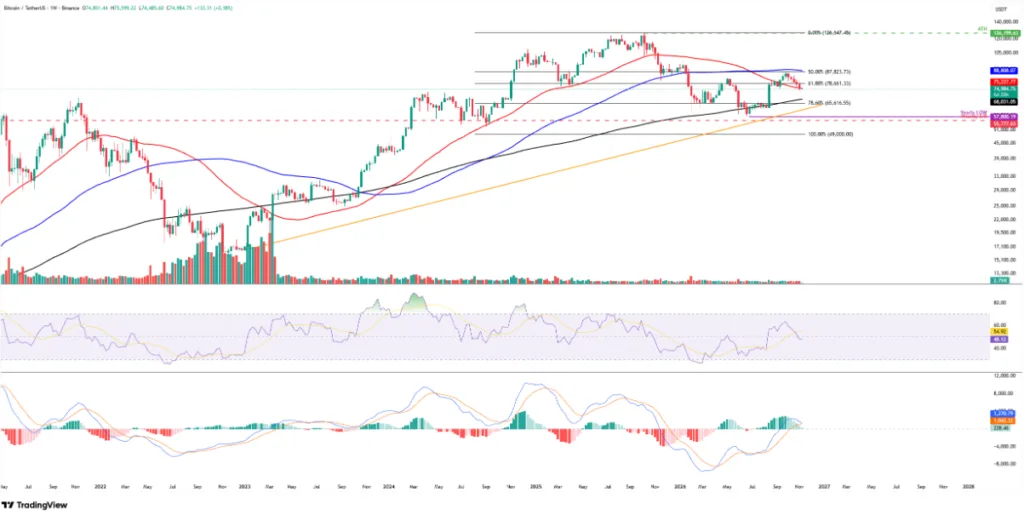
If selling pressure continues, Bitcoin could decline toward the 200-week SMA at $68,031.
The daily chart also points to a bearish outlook. BTC remains below its major moving averages, with the 200-day EMA at $76,458 acting as the nearest resistance. Further barriers stand at $77,624 and $79,305, corresponding to the 100-day and 50-day EMAs.

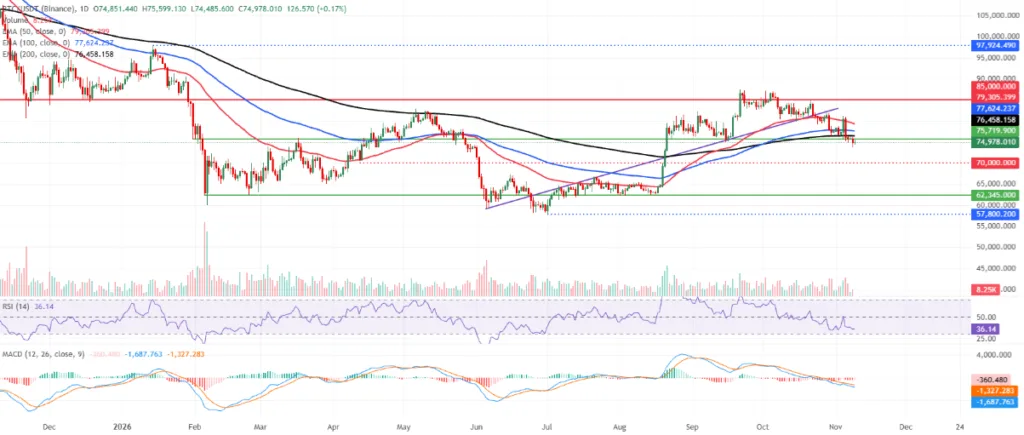
The daily RSI is hovering near 36, while the MACD remains below zero. Both indicators suggest that bearish momentum remains dominant.
A continued decline could expose the psychological support level at $70,000, particularly if Bitcoin fails to attract fresh buying demand.
Can Bitcoin Recover Above $75,000?
A recovery above the 50-week SMA near $75,222 would be an important first step toward improving Bitcoin’s technical outlook.
However, BTC would also need to reclaim the 200-day EMA at $76,458 and the 100-day EMA at $77,624 to strengthen its recovery prospects.
A sustained move above these levels could open the door toward the 50-day EMA near $79,305. Beyond that, the next major resistance area sits around $85,000.
On the weekly chart, a stronger recovery could also bring the 61.8% Fibonacci retracement level at $78,661 into focus.
For now, Bitcoin faces pressure from weakening ETF demand, tighter monetary policy expectations and deteriorating technical indicators. Whether buyers can defend the $70,000 area may determine the direction of its next major move.
ALSO READ: IOTA Price Risks Further Losses as $0.0361 Support Weakens Despite Mainnet Progress
DISCLAIMER:
This article reflects the author’s views and is provided for informational purposes only. While we strive for accuracy, the publisher does not guarantee that all information is complete or current. Readers should verify important information and consult appropriate sources before making decisions based on this content.