

- Bitcoin may still be undervalued, as on-chain metrics like declining exchange reserves and a low Stablecoin Supply Ratio suggest strong holding behavior and significant buying power in the market.
- Additional signals, including decreasing USDT dominance and a bullish RSI breakout, point to improving investor sentiment and a potential BTC rally ahead.
Despite Bitcoin trading near $85,550, fresh on-chain data suggests the top cryptocurrency may still be significantly undervalued. Analysts are pointing to several bullish indicators that hint at a potential rally — one that might catch many investors off guard.
Long-Term Holders Tighten Supply
A key sign of Bitcoin’s strength lies in its declining exchange reserves, which have dropped to around 2.43 million BTC — down significantly from the 3.40 million BTC seen during the 2021 bull run. According to on-chain analyst BorisVest, this decline signals long-term confidence, as fewer coins are available for sale on exchanges.
“Bitcoin is being withdrawn from exchanges after seven years. The fact that it’s not readily available for sale suggests it is being held for the long term,” said BorisVest.
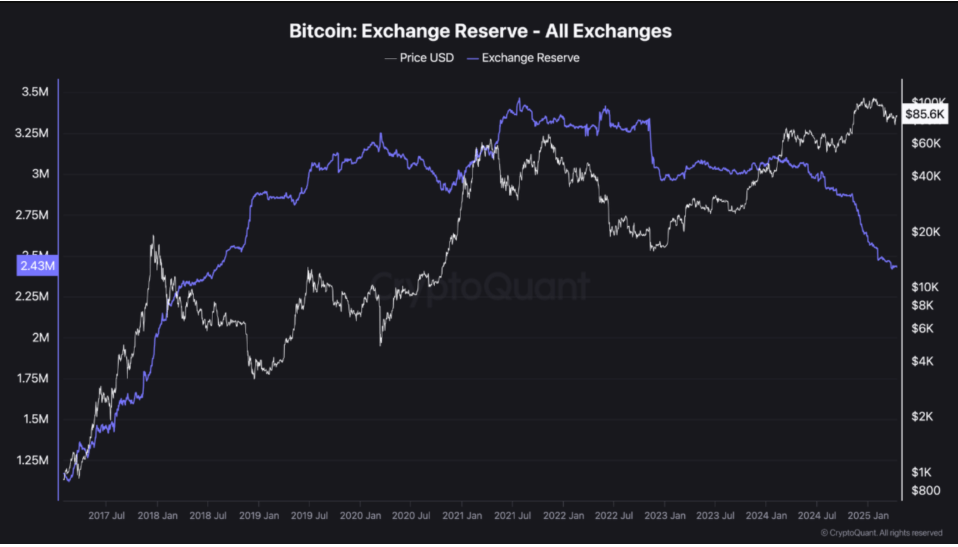
This tightening supply creates upward pressure on price. With fewer BTC in circulation, any surge in demand could drive prices higher — possibly setting the stage for a new breakout.
Stablecoin Supply Ratio (SSR) Confirms Undervaluation
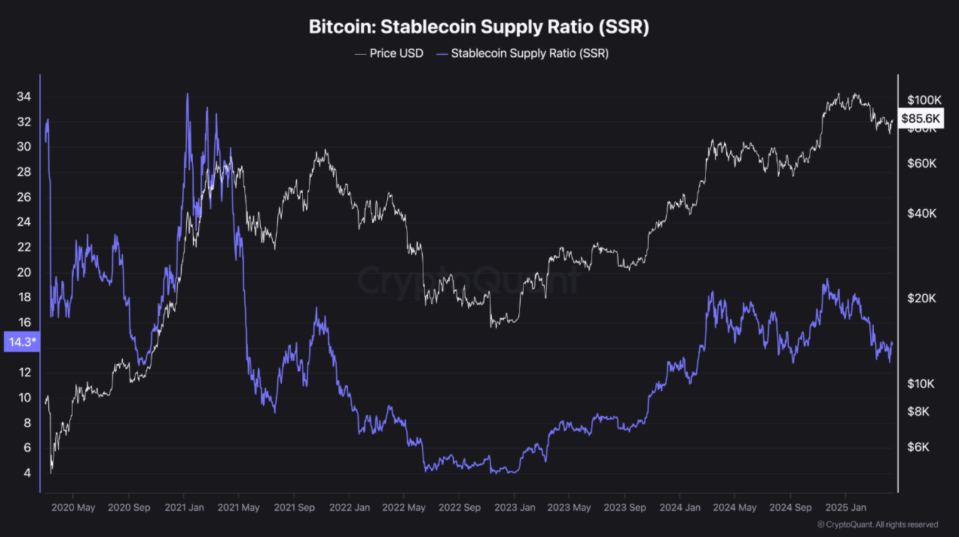
Another crucial metric reinforcing this bullish outlook is the Stablecoin Supply Ratio (SSR), currently at 14.3. This is well below its 2021 peak of 34. A lower SSR implies there’s strong stablecoin purchasing power in the market, meaning investors still have plenty of dry powder to buy BTC at current levels.
BorisVest explains that as the SSR increases, BTC tends to be overvalued. Since we’re far from those highs, it’s a compelling signal that Bitcoin remains undervalued relative to available capital.
Market Sentiment Turning Risk-On
Adding to the optimism, crypto analyst Titan of Crypto observed a hidden bearish divergence in the USDT dominance chart. While the term might sound negative, in this context, it’s actually a bullish signal. It shows that investors are moving out of stablecoins and back into risk assets like BTC — typically a sign of growing confidence in the market.
On top of this, Bitcoin’s weekly Relative Strength Index (RSI) has broken out of a long-standing downtrend, reinforcing the case for a potential rally. And with exchange net flows showing more outflows than inflows, analysts believe the next big price movement could be just around the corner.
If the data holds true, BTC’s current level might be a bargain — and the $100,000 target no longer feels so far-fetched.
DISCLAIMER:
The views and opinions expressed herein are solely those of the author or advertiser and do not necessarily reflect the views of the publisher. The publisher does not endorse or guarantee the accuracy of any information presented in this article. Readers are encouraged to conduct further research and consult additional sources before making any decisions based on the content provided.


