
- Bitcoin is poised for a potential rally to $125,000 if it can break through key resistance levels, supported by a “cup and handle” pattern and a parabolic curve.
- However, recent institutional hesitancy and market volatility could impact this upward trajectory.
Bitcoin (BTC) is on the cusp of a potentially historic rally, with the cryptocurrency targeting a significant price level of $125,000 if it can successfully break through a key resistance point. As BTC continues its volatile journey, market analysts are closely watching for signs that could signal a new all-time high.
The ‘Cup and Handle’ Pattern: A Bullish Signal
According to the popular crypto analyst known as TheMoonCarl, Bitcoin is currently navigating a critical phase in its price movement. The analyst highlighted the formation of a “cup and handle” pattern, which is often seen as a strong bullish indicator. This pattern, which has been developing since Bitcoin’s decline in late 2021, consists of two main phases: the “cup,” representing a rounded bottom of price consolidation, and the “handle,” a brief period of consolidation or retracement.
TheMoonCarl’s analysis suggests that if Bitcoin can break out from the handle portion, particularly around the $70,000 level, it could trigger a surge towards $125,000. This price target is calculated by adding the height of the cup to the breakout point, a method traditionally used in technical analysis to estimate potential upside moves.
Parabolic Curve: A Steeper Ascent on the Horizon?
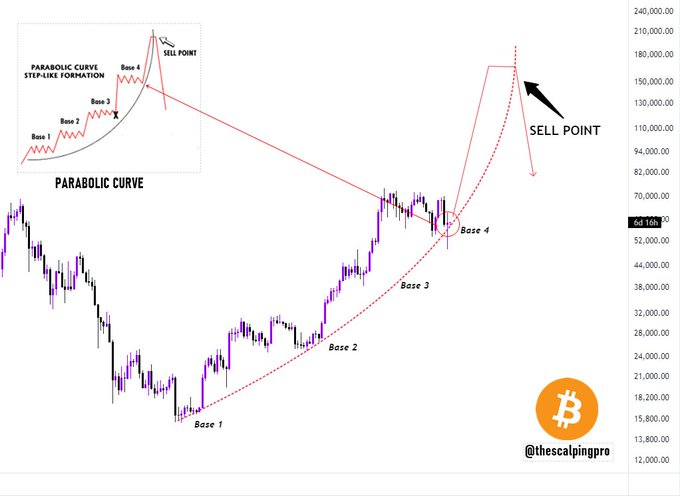
Adding to the bullish sentiment, another crypto analyst known as TheScalpingPro has pointed out that Bitcoin is also forming a parabolic curve, a pattern associated with strong upward momentum. This curve could lead to accelerated gains, potentially driving Bitcoin’s price to a peak of around $180,000.
However, TheScalpingPro cautioned that such parabolic movements are often followed by sharp corrections. Therefore, traders and investors might want to keep an eye out for a possible “sell point” near the top of the curve to avoid getting caught in a sudden downturn.
Institutional Hesitancy and Current Price Action
Despite these bullish patterns, Bitcoin’s recent price action has been somewhat lackluster. The cryptocurrency briefly dipped below $49,000 amid fears of a U.S. recession but managed a swift recovery, hitting $62,500 on the weekly chart. At the time of writing, Bitcoin was trading at $58,976, down over 2% in the past 24 hours but still up nearly 20% on the week.
Institutions seem to have temporarily stopped buying, and the price of $BTC dropped 4.5% today!
— Lookonchain (@lookonchain) August 12, 2024
We noticed that institutions stopped receiving $USDT from #TetherTreasury and transferring it to exchanges 2 days ago.https://t.co/0XKiPmjJed pic.twitter.com/NRFkp4Vqan
A contributing factor to Bitcoin’s sluggish performance could be the perceived hesitation from institutional investors, particularly in purchasing stablecoins like USDT, which are often used as an entry point into the crypto market. According to on-chain analytics platform Lookonchain, institutions may have paused their buying activity, leading to reduced buying pressure and diminished investor appetite.

The Road to $125,000
Bitcoin to reach the highly anticipated $125,000 mark, reclaiming the $60,000 resistance level is crucial. A successful breakout above $70,000 could set the stage for a new record high, driven by the bullish formations currently in play. However, as with any market, risks remain, and traders should be prepared for potential volatility along the way.