



- Dogecoin has fallen below key support at $0.0930, forming a descending triangle pattern as price trades under pressure near $0.0900 levels.
- Analysts say this setup could lead to a major breakout, with potential for a 30% move in either direction.
Dogecoin (DOGE) has slipped below a key support level, forming a descending triangle pattern that is now attracting attention from analysts. The price action comes as indicators begin to flash mixed signals, leaving traders watching closely for a breakout.
DOGE Drops Below Key Support Levels
Dogecoin fell below the $0.0930 mark, reaching a low near $0.0903 before attempting a small recovery. The move pushed the token below the 100-hour simple moving average, signaling short-term weakness in price momentum.

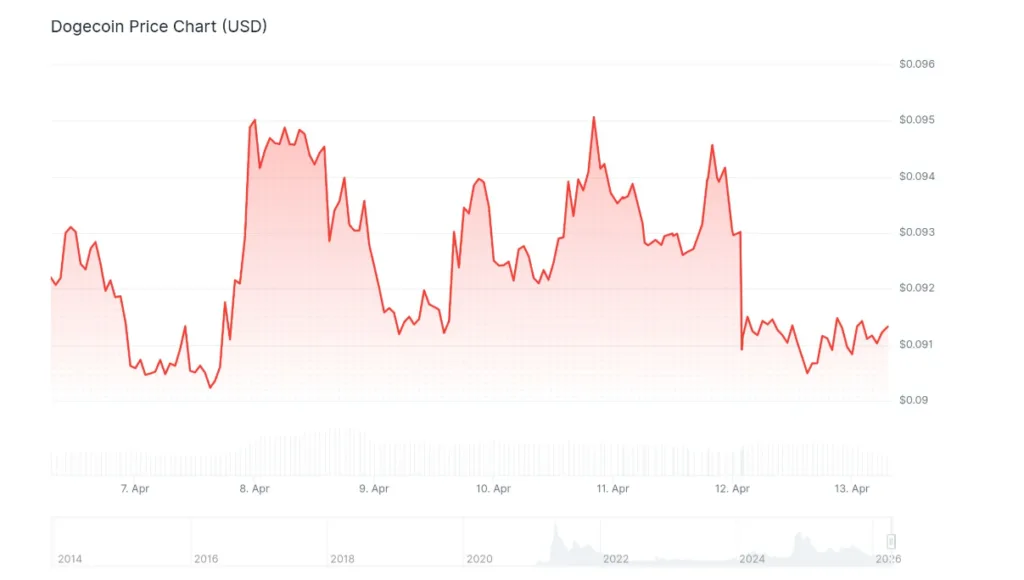
A previously respected bullish trend line around $0.0925 was also broken on the hourly chart. This added further pressure, as buyers failed to defend key intraday support zones.
Descending Triangle Forms on 4-Hour Chart
A descending triangle pattern has now formed on the 4-hour chart. This structure often signals a buildup phase before a sharp move in either direction.
On the upside, immediate resistance sits at $0.0925. If DOGE breaks higher, the next levels to watch are $0.0930 and $0.0938, followed by stronger resistance near $0.0950 and $0.0980.
On the downside, support begins at $0.0905. Below that, $0.0900 is critical, with a stronger floor at $0.0880. A breakdown under that level could expose DOGE to further losses toward $0.0820 or even $0.0800.
Analyst Sees Potential for a 30% Move
Crypto analyst Ali Martinez noted that DOGE is approaching the apex of the descending triangle. He suggested that this setup increases the probability of a strong move, potentially as large as 30%, though the direction remains unclear.
As Dogecoin $DOGE moves closer to the apex of this triangle, the chances of a 30% move increase substantially. pic.twitter.com/4hQ4t2heDo
— Ali Charts (@alicharts) April 12, 2026
If DOGE breaks upward from the pattern, a 30% rally could push the price close to $0.11, a level last seen in early February. Martinez has highlighted this formation multiple times in recent analysis, reinforcing its importance among traders.
Indicators Show Mixed Market Signals
Technical indicators are currently sending mixed signals. The MACD has flashed a buy signal, suggesting early bullish interest.
However, the Relative Strength Index (RSI) and Bull Bear Power remain neutral, showing no clear dominance from either buyers or sellers.
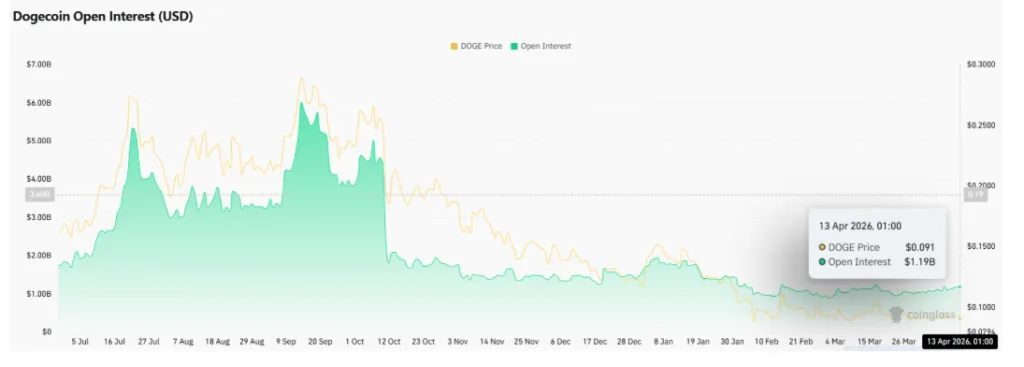
Meanwhile, DOGE futures open interest rose by 1.61% over the past 24 hours, according to Coinglass data. This suggests growing participation in the derivatives market, often a sign of an upcoming larger price move.

Dogecoin Price Outlook
Dogecoin continues to trade within a tight range as broader market pressure keeps volatility in check. Traders are now watching closely for a breakout from the descending triangle, which could determine the next major trend.
A clear move above resistance could trigger renewed bullish momentum, while a breakdown below support may extend the current bearish pressure.
ALSO READ: Pi Network Distributes 26.5M PI as KYC Milestone Hits 18M Users
DISCLAIMER:
The views and opinions expressed herein are solely those of the author and do not necessarily reflect the views of the publisher. The publisher does not endorse or guarantee the accuracy of any information presented in this article. Readers are encouraged to conduct further research and consult additional sources before making any decisions based on the content provided.