



- Dogecoin is testing a key falling wedge boundary.
- A breakout could target $0.38, while rejection may send DOGE lower.
Dogecoin (DOGE) is approaching a key point on its weekly chart after spending nearly two years inside a narrowing falling wedge. With DOGE now trading around $0.084, traders are watching whether the pattern will break higher toward $0.38 or lead to another decline.
DOGE was trading at $0.08414 as of September 18, 2026, up 3.8% over the previous 24 hours. Its 24-hour range stood between $0.08054 and $0.08448, while its market capitalization was about $13.13 billion.
Dogecoin Price Faces a Key Technical Test
The weekly chart shows DOGE trading inside a falling wedge that has narrowed since the coin’s 2024 peak near $0.48. Price is now close to the apex of the pattern, where the two trendlines are converging.
This setup leaves DOGE at an important technical level. A weekly close above the upper trendline could confirm a breakout, while rejection from the boundary could send the price back toward lower support levels.
The RSI is currently at 45.88, while its moving average stands at 38.14. The reading remains below the midpoint but shows that momentum is beginning to turn higher.
Can DOGE Reach $0.38?
A confirmed breakout above the falling wedge would put $0.20717 among the first major resistance levels to watch. If DOGE moves through that area with sustained buying volume, the next levels identified by the technical setup are $0.30766 and $0.38230.
The $0.38 level is therefore a longer-range target rather than an immediate price objective. DOGE would need to clear several resistance areas before reaching it, and the breakout would need confirmation from weekly price action and trading volume.
Recent liquidation data also shows some pressure on short positions. More than $1.10 million in DOGE positions were liquidated over the previous 24 hours, with shorts accounting for about $740,960 compared with $359,330 in long liquidations.
If DOGE continues higher, further short covering could add buying pressure. However, a failed breakout could quickly change the setup.
What If Dogecoin Falls Below Support?
The first major support level on the weekly structure is around $0.06881. A break below this area would weaken the bullish breakout scenario and expose the next support near $0.04914.
A deeper decline could bring $0.02630 into focus. That level represents a much more bearish outcome and would require DOGE to lose several important support zones.
For now, the $0.06881 area remains an important level because it could determine whether the current recovery develops into a larger move or fails.
Dogecoin Support and Resistance Levels
| Support | Resistance |
|---|---|
| $0.06881 | $0.20717 |
| $0.04914 | $0.30766 |
| $0.02630 | $0.38230 |
DOGE Trading Activity Remains Concentrated
Dogecoin’s trading volume remains concentrated across several major exchanges. Binance recorded about $413.68 million in 24-hour DOGE volume, followed by OKX at $226.43 million and Bybit at $108.45 million.

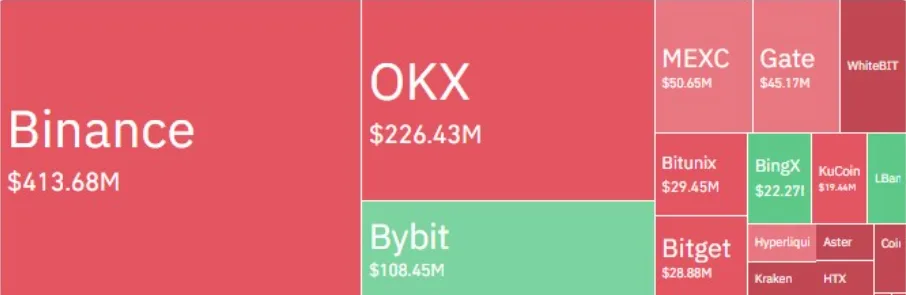
MEXC, Gate and Bitget also contributed to trading activity, while smaller amounts of liquidity were spread across exchanges including KuCoin, WhiteBIT, Bitunix, BingX and HTX.
The concentration of trading activity means changes in volume could become important if DOGE approaches the upper wedge boundary and attempts a breakout.
DOGE’s Supply Structure Remains Part of the Debate
Dogecoin’s supply model continues to feature in discussions around its long-term valuation. Unlike cryptocurrencies with a fixed maximum supply, DOGE does not have a hard supply cap.
Recent commentary from BSC News again raised the question of how Dogecoin’s ongoing supply issuance could affect its long-term value.


At the same time, chart-focused analysts have continued to monitor the falling wedge, with attention focused on DOGE’s retest of the pattern’s upper boundary.
DOGE and Bitcoin Remain Closely Linked
Dogecoin has historically followed broader Bitcoin market cycles, although its price movements can be significantly larger in either direction.
Bitcoin’s direction could therefore influence DOGE’s next major move. A stronger risk appetite across the crypto market could support a breakout attempt, while weakness in Bitcoin could make it harder for DOGE to sustain a move above the wedge.
The current technical structure does not confirm either outcome yet. DOGE remains at a decision point where the next weekly closes could provide a clearer signal.
Dogecoin Price Prediction: Key Levels to Watch
The current setup presents three possible paths based on the weekly wedge structure. A confirmed breakout could put $0.20717, $0.30766 and $0.38230 on the chart, while continued consolidation could keep DOGE around the $0.08-$0.09 range.

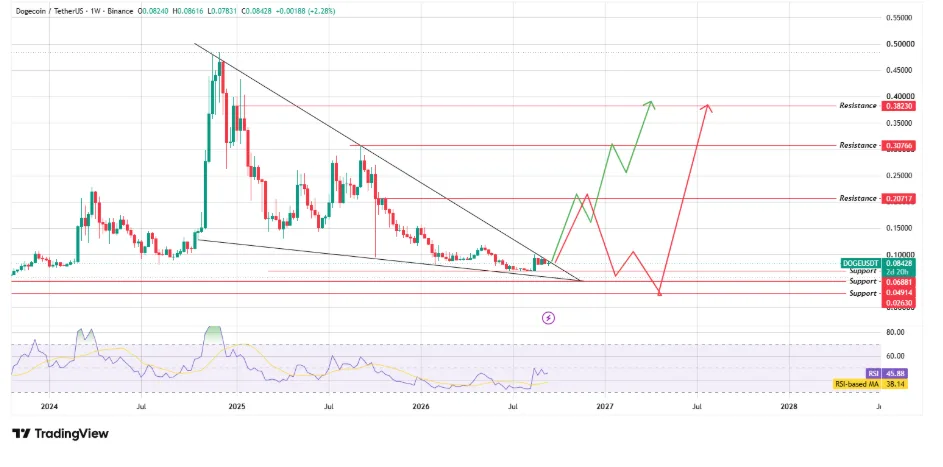
A rejection at the wedge’s upper boundary would instead bring $0.06881 into focus, followed by $0.04914 if that support breaks.
These levels are based on the technical structure described above and should not be treated as guaranteed price targets. DOGE’s next move will depend on whether buyers can establish a sustained breakout above the falling wedge or sellers regain control near the apex.
ALSO READ: Pi Network Price Under Pressure as Bearish Flag Signals More Downside
DISCLAIMER:
This article reflects the author’s views and is provided for informational purposes only. While we strive for accuracy, the publisher does not guarantee that all information is complete or current. Readers should verify important information and consult appropriate sources before making decisions based on this content.