



- Dogecoin, Shiba Inu and Pepe face selling pressure after strong gains last week.
- Key support and resistance levels will determine whether the meme coins recover or extend their declines.
Dogecoin, Shiba Inu and Pepe are showing signs of a pullback after posting strong gains last week. Profit-taking has reduced buying pressure, leaving the three meme coins at important technical levels.
Dogecoin (DOGE) has recovered slightly after two straight sessions of losses. Shiba Inu (SHIB) is holding above key support, while Pepe (PEPE) remains below a major resistance trendline.
Dogecoin struggles below $0.10
Dogecoin trades near $0.0860 after last week’s 35% rally stalled around the $0.10 psychological level. The pullback has kept DOGE below its 200-day EMA at $0.0956.

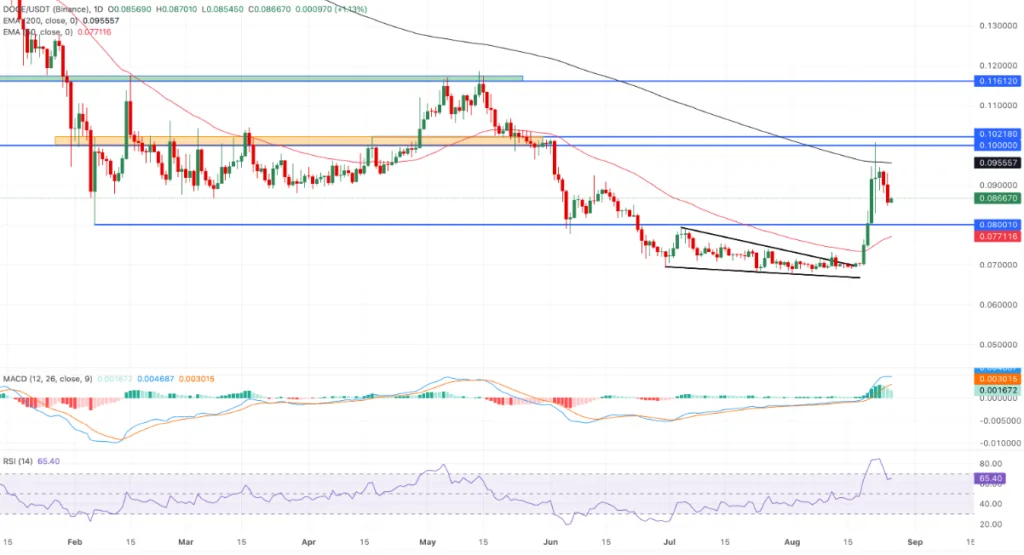
DOGE remains above its 50-day EMA at $0.0771. This level could become important if selling pressure increases. A move above $0.0956 could put the $0.10 level back within reach. A sustained breakout above both levels may open the way toward the $0.1161 supply zone.
Technical indicators remain relatively positive. The MACD histogram is still positive, while the RSI stands at 65 after moving down from overbought conditions. On the downside, $0.0800 is the first major support. The 50-day EMA near $0.0771 could provide another layer of support.
Shiba Inu holds key support
Shiba Inu is trading around the $0.00000521 support area after last week’s 25% rally faced resistance near $0.00000602.

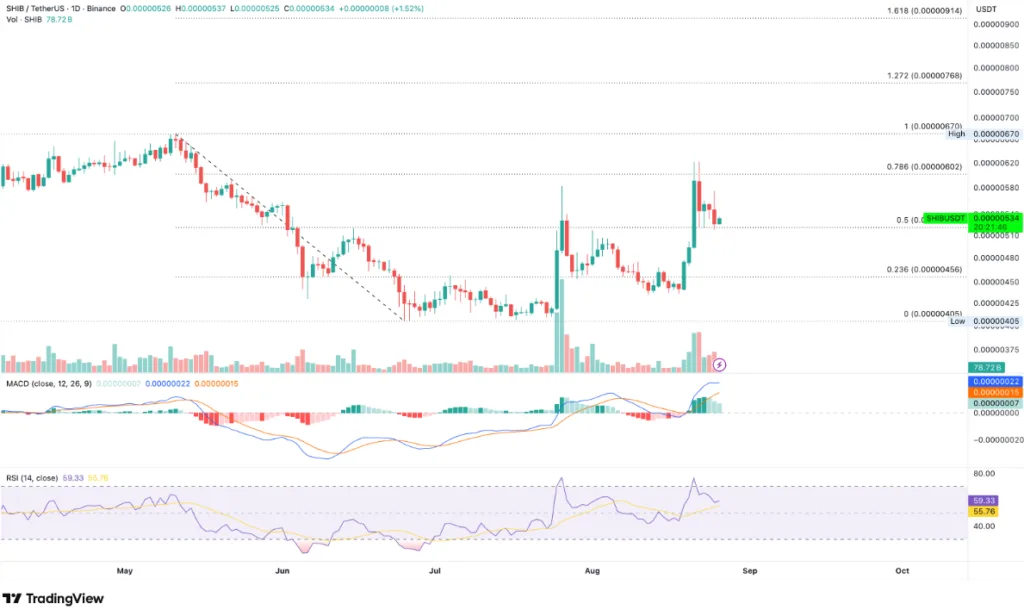
The $0.00000602 level represents the 78.6% Fibonacci retracement of the previous decline. A breakout above this resistance could strengthen the recovery and put the $0.00000670 swing high in focus.
However, buying pressure has started to ease. The MACD remains positive, but its histogram is declining. The RSI has also fallen to 59, showing weaker buying interest.
A break below $0.00000521 could expose SHIB to further losses. The next downside levels are around $0.00000456 and $0.00000402.
Pepe faces resistance after sharp rally
Pepe trades below $0.00000400 after falling 5% in the previous session. PEPE gained about 60% last week but failed to break a long-term resistance trendline near $0.00000456.

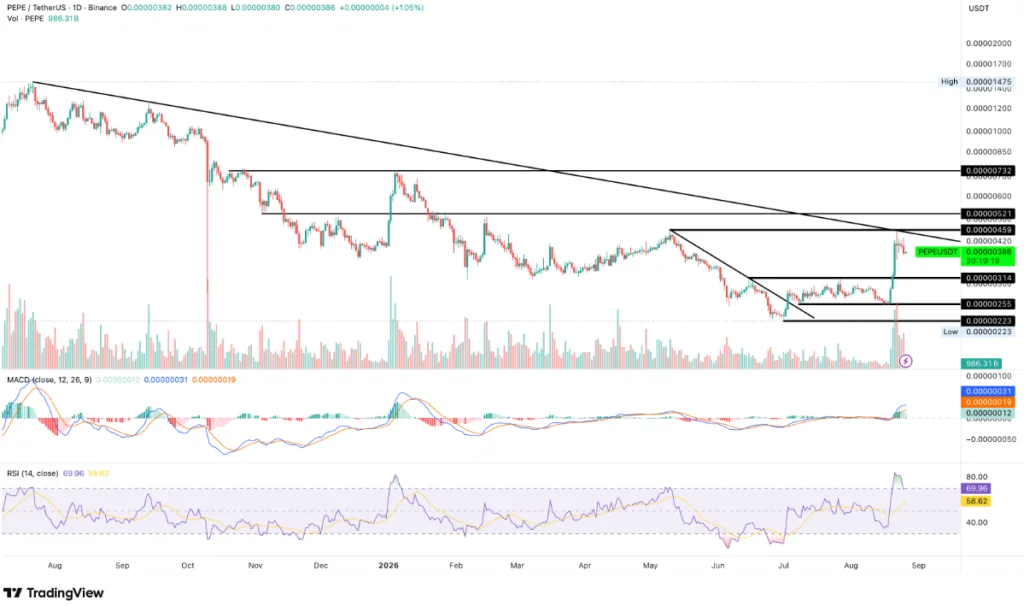
A move above $0.00000456 could confirm a breakout. If that happens, PEPE could target $0.00000521, followed by $0.00000732.
The RSI has dropped to 69 after reaching overbought territory. Meanwhile, the declining MACD histogram points to weaker buying pressure.
If PEPE turns lower, $0.00000314 is the first key support. A break below that level could send the price toward $0.00000255.
Dogecoin, Shiba Inu and Pepe are now facing important resistance and support levels after last week’s sharp gains. Their next moves could depend on whether buyers return or profit-taking continues.
ALSO READ: Tether Drops $120M Uruguay Bitcoin Mining Project Over Power Dispute
DISCLAIMER:
The views and opinions expressed herein are solely those of the author and do not necessarily reflect the views of the publisher. The publisher does not endorse or guarantee the accuracy of any information presented in this article. Readers are encouraged to conduct further research and consult additional sources before making any decisions based on the content provided.