- Ethereum’s gas fees hit record lows, while bearish sentiment grows as supply rises and ETF flows remain weak.
- Despite a potential price rebound, technical indicators suggest further downside risk before a possible rally.
Ethereum’s gas fees recently reached record lows, coinciding with a potential critical price move. As the market eyes a significant shift, investors remain cautious, observing mixed signals from ETF flows, technical analysis, and market sentiment.
Gas Fees Plummet as Supply Uptrend Continues
On Saturday, Ethereum’s average daily gas fees plunged to an all-time low of 1.06 Gwei, as reported by Ultrasound.money. This drop in gas fees also led to a sharp reduction in ETH’s burn rate, which fell to 115 ETH, according to CryptoQuant data. The low gas fees are primarily driven by Ethereum’s Dencun upgrade, which introduced “blobs” that reduce Layer 2 network fees. Consequently, Ethereum’s burn rate has decreased, leading to a sustained uptrend in ETH supply.
Between April and August 2024, Ethereum’s total supply increased by over 220,000 ETH, while its price dropped by more than 30%. This rise in supply, coupled with weakening demand, could put further downward pressure on Ethereum’s price, limiting the impact of global Ethereum ETFs, which saw net inflows of $4.2 million last week. However, US spot ETH ETFs reported significant outflows of $14.1 million, reflecting investor caution amidst ongoing volatility.
Technical Analysis: ETH Poised to Repeat Historical Price Pattern
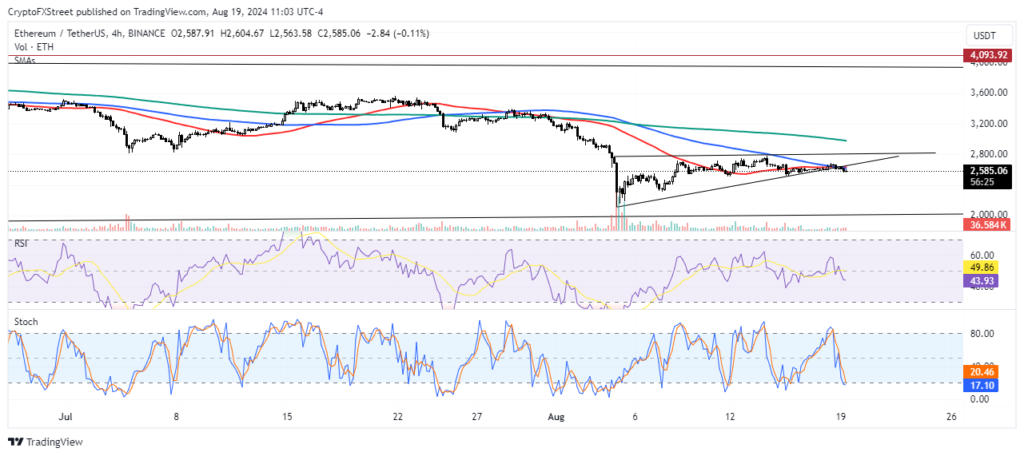
Ethereum’s price action hints at a potential repeat of a historical pattern seen in previous years. On Monday, ETH traded around $2,570, down over 3% for the day. The bearish sentiment is reflected in funding rates turning negative at -0.0036, indicating that short positions are dominating the market.

On the 4-hour chart, ETH recently broke below the lower trendline of an ascending triangle, signaling that sellers are gaining momentum. This breach suggests the start of a bearish trend, although technical indicators like the Stochastic Oscillator suggest a possible short-term rebound as ETH enters oversold territory.
Further resistance is evident on the daily chart, where ETH struggles against a descending trendline that has held since May 30. Analysts predict ETH may dip to the $2,000 to $2,200 range in the coming weeks before attempting a more substantial rally. This potential decline mirrors similar price movements observed in late 2022 and mid-2023.

Despite the bearish signals, the daily Awesome Oscillator (AO) indicates that selling momentum could be slowing. In the short term, Ethereum might see a brief uptick to around $2,648 as traders aim to liquidate positions worth over $21 million.
Investor Sentiment and Market Outlook
The current market environment remains cautious, as indicated by the ETH Fear and Greed Index, which sits at 34, suggesting fear and uncertainty dominate sentiment. With mixed signals from ETF flows and critical technical indicators pointing in different directions, Ethereum’s next major move could determine whether it breaks further downward or surprises with a swift rebound.


