



- Ethereum has fallen nearly 60%, leaving ETF investors with about $5.15 billion in unrealized losses.
- ETH trades below $2,000 as selling pressure persists.
Ethereum’s prolonged price slump is placing growing pressure on investors, especially those holding U.S. spot exchange-traded funds. With ETH trading well below key psychological levels, recent data shows that ETF holders are now facing billions of dollars in unrealized losses, even as large-scale withdrawals remain relatively contained.
Ethereum ETFs Sit on Billions in Unrealized Losses
Ethereum is trading around $1,920, marking a steep drop of nearly 60% from its October highs. This decline has pushed ETH ETF investors into a difficult position. According to analysis shared by James Seyffart, the average entry price for many ETF buyers sits close to $3,500, translating into roughly $5.15 billion in unrealized losses.
Ethereum ETF holders are sitting in a worse position than their Bitcoin ETF brethren. The current ETH price of $2,000 is way below their average cost basis of ETF holders at about ~$3,500. It's a painful proposition. But its one that Eth ETF holders have experienced already. pic.twitter.com/tqIXlqNNH5
— James Seyffart (@JSeyff) February 10, 2026
Despite the scale of these losses, ETF investors have not rushed for the exits. Net inflows across U.S. spot Ethereum ETFs have declined from about $15 billion to just under $12 billion, suggesting that many holders are choosing to wait out the downturn rather than lock in losses.
However, sentiment weakened again midweek. U.S. spot ETH ETFs recorded $129.1 million in net outflows, reversing earlier mild inflows. Fidelity’s Ethereum fund accounted for more than half of the withdrawals, posting $67 million in outflows.
Derivatives Signal Continued Bearish Pressure
The stress is not limited to ETFs. Spot market investors are also underwater, with ETH trading below the average cost basis of around $2,300. On the derivatives side, funding rates have stayed negative for several days, reflecting bearish positioning in futures markets.

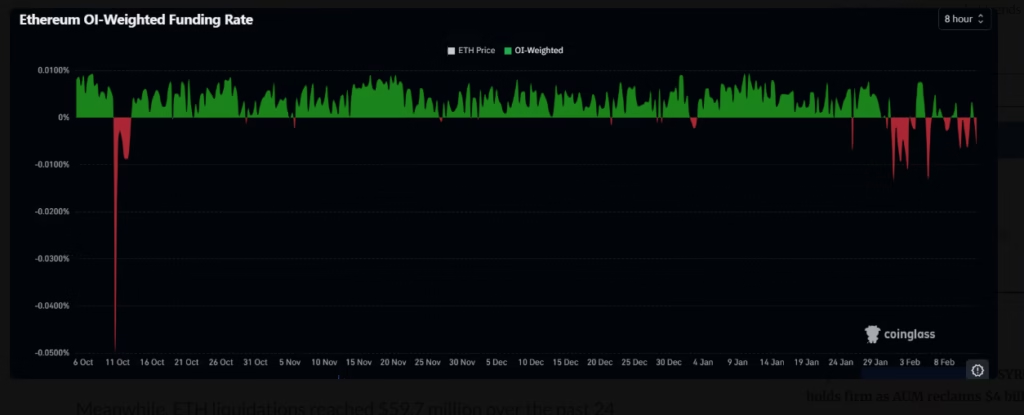
Liquidations underline this pressure. Over the past 24 hours, Ethereum liquidations totaled $59.7 million, led by $35.3 million in long liquidations. This indicates that bullish traders are still being forced out as prices drift lower.
Ethereum Price Forecast: Key Levels to Watch
From a technical perspective, ETH remains locked in a downtrend. The price is trading below a declining 20-day EMA near $2,323, which continues to cap recovery attempts. Momentum indicators suggest stretched conditions, but confirmation of a rebound is still lacking.

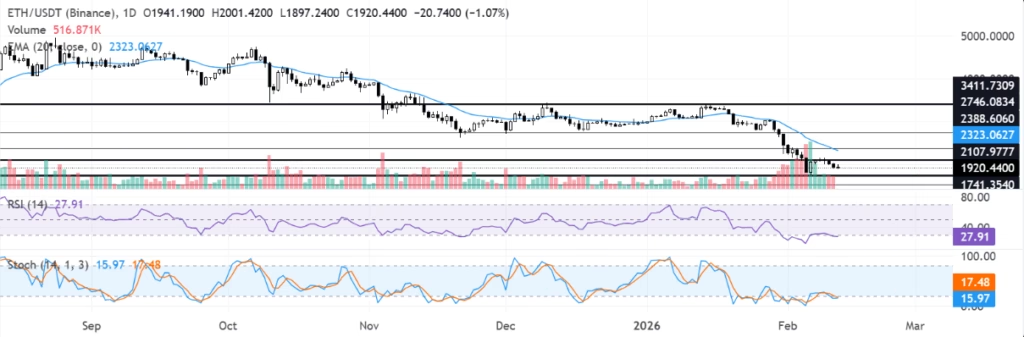
Immediate resistance sits at $2,107, followed by $2,388. On the downside, key support lies near $1,741, with a deeper level at $1,524. A sustained break below this zone could expose ETH to a move toward $1,404, extending the broader bearish structure.
ALSO READ: Pi Network Mainnet Upgrade Requires Nodes to Act Before February 15
DISCLAIMER:
The views and opinions expressed herein are solely those of the author and do not necessarily reflect the views of the publisher. The publisher does not endorse or guarantee the accuracy of any information presented in this article. Readers are encouraged to conduct further research and consult additional sources before making any decisions based on the content provided.