


- Ethereum fell below $2,150 and is now trading near $2,113 after breaking a key flag pattern, raising concerns about further downside.
- Traders are watching the $2,050–$2,070 support zone, which could trigger either a rebound or a deeper decline if it fails.
Ethereum is under renewed pressure after slipping below a key support level. The price dropped more than 3% in 24 hours, trading near $2,113. This move pushed ETH below $2,150 and raised concerns about a deeper breakdown.
Market participants are now closely watching whether the decline continues or turns into a short-term recovery bounce.
Ethereum loses $2,150 support as selling pressure increases
Ethereum failed to hold the $2,150 support zone, triggering a sharp intraday decline. The price weakness reflects growing selling pressure after weeks of sideways movement.
The drop below this level signals that short-term control has shifted toward sellers. ETH is now testing lower demand areas, with traders adjusting their expectations for further downside. At the time of writing, Ethereum is hovering near $2,113 after a steady 3% daily drop.
Flag pattern breakdown raises bearish concerns
Analysts tracking Ethereum charts say the asset is breaking down from a daily flag pattern. This structure often signals continuation of the previous trend when support fails.
Ali Charts noted that the breakdown suggests weakening momentum in the current range. The chart also shows that ETH lost its lower trend boundary after several days of consolidation.

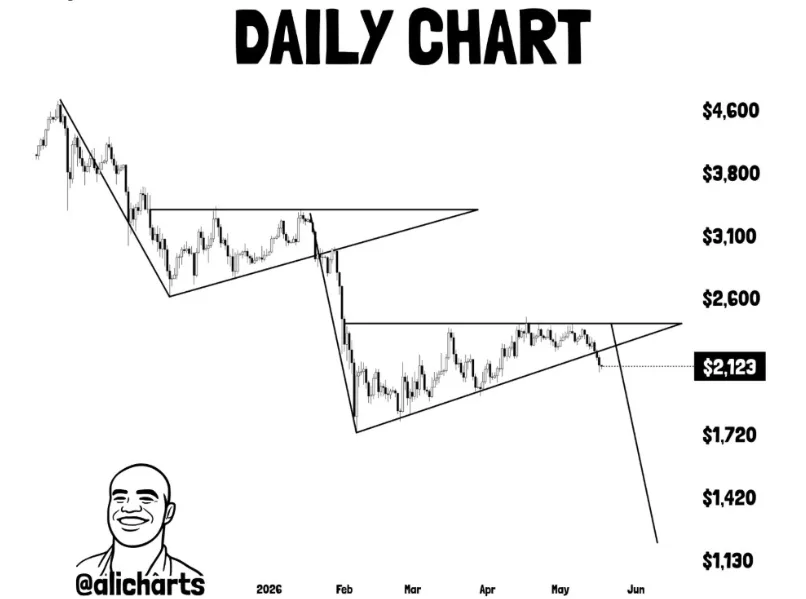
If the breakdown continues, price levels such as $1,720, $1,420, and even $1,130 could come into view over time. These levels represent deeper demand zones from earlier market cycles.
Still, not all analysts agree on a sustained downtrend.
$2,050 to $2,070 becomes the key support zone
According to traders monitoring Ethereum, the next critical support lies between $2,050 and $2,070. This area is now seen as a major decision zone for the market.

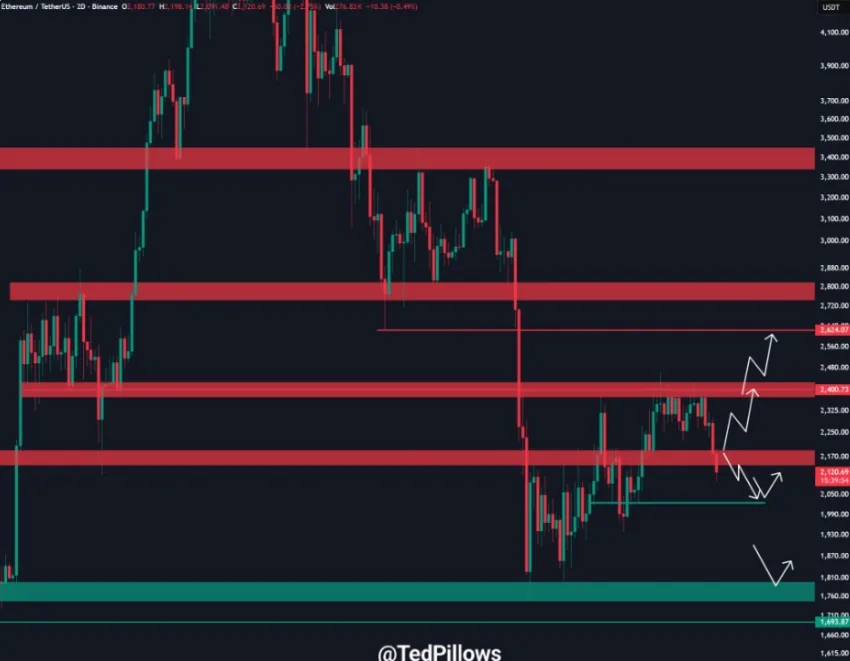
Some analysts believe ETH could form a short-term bottom here if buyers step in strongly. Oversold conditions on lower timeframes also increase the chance of a temporary bounce.
If buyers defend this zone, Ethereum could rebound toward $2,170. A stronger recovery would require a move back above $2,150 and later $2,400.
Failure to hold this support could expose ETH to a deeper drop toward the $1,800 region.
Mixed signals shape the next move
Market sentiment around Ethereum remains divided. Some analysts view the current drop as the start of a broader bearish continuation.
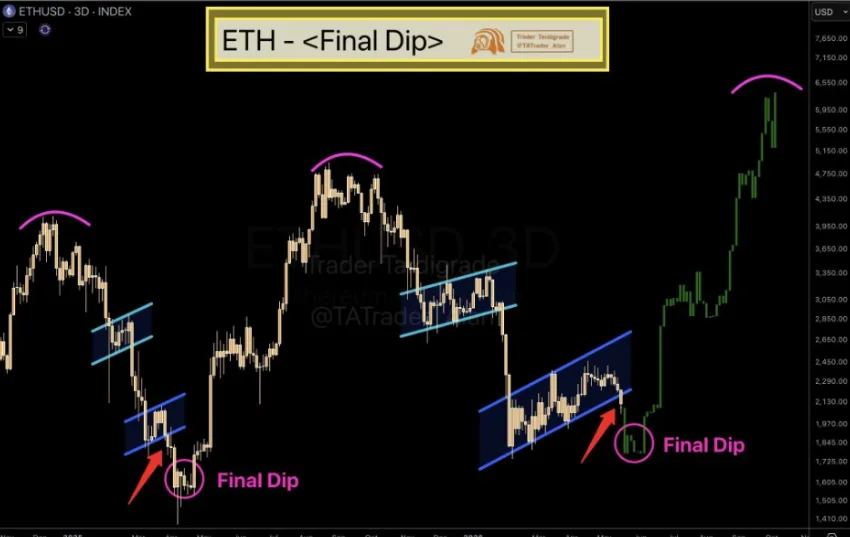
Others believe Ethereum may be approaching a final dip phase before recovery begins. Historical patterns are being used to support this view, showing similar breakdowns before strong reversals in past cycles.

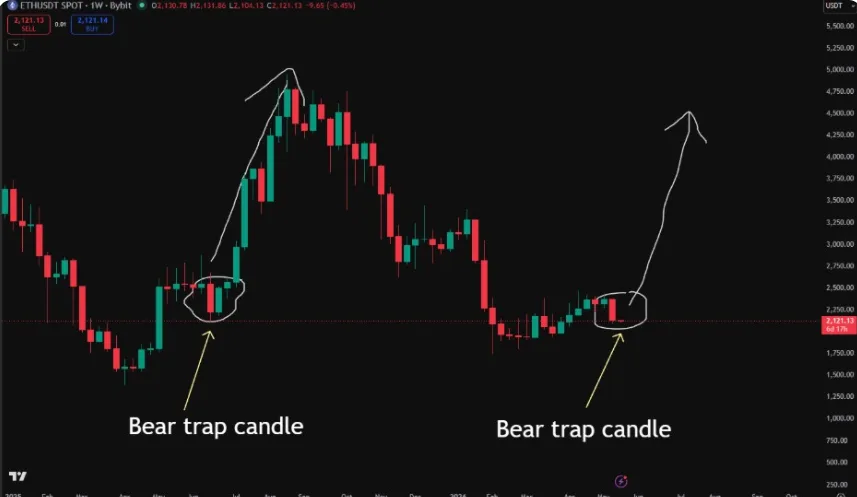
There is also a comparison to earlier “bear trap” setups, where weak weekly candles preceded sharp recoveries. This raises the possibility that current weakness may not fully reflect long-term direction.

What traders should watch next?
The next move for Ethereum depends on how the price reacts around the $2,050 support zone.
Key scenarios include:
- Bullish case: Strong bounce from $2,050–$2,070 and recovery above $2,150
- Neutral case: Sideways movement between $2,050 and $2,150
- Bearish case: Breakdown below $2,050, opening room toward $1,800
For now, Ethereum remains in a critical technical phase where both recovery and further downside remain possible.
Ethereum is at a turning point after breaking a key flag pattern. The $2,050 support zone will likely decide whether the market stabilizes or extends its decline in the coming sessions.
ALSO READ: Revolut Launches Dogecoin Debit Card Across UK and EU Markets
DISCLAIMER:
The views and opinions expressed herein are solely those of the author and do not necessarily reflect the views of the publisher. The publisher does not endorse or guarantee the accuracy of any information presented in this article. Readers are encouraged to conduct further research and consult additional sources before making any decisions based on the content provided.