
- Ethereum is holding above key support as ETF inflows and improving on-chain data support its recovery.
- A break above $2,800 could put the $3,000 level back in focus.
Ethereum (ETH) is holding above key support levels after its latest attempt to break through $2,800 lost momentum. Despite the pullback, strong spot Ethereum ETF inflows and several on-chain indicators continue to support the broader recovery.
ETH had gained about 8.5% over the past month before reaching the $2,800 area. The level had been a short-term target following a breakout from a bullish flag pattern.
The next major question for traders is whether Ethereum can regain $2,800 and eventually move toward the $3,000 mark.
Ethereum ETF Inflows Keep Demand in Focus
One of the main factors supporting Ethereum’s recent recovery has been continued demand through US spot Ethereum ETFs.
The funds recorded six straight sessions of net inflows through September 25, with total inflows reaching about $834 million over the streak. The latest session added $86.95 million, according to data tracking the US spot Ether ETF market.
The inflow streak is notable because it continued even as ETH struggled to stay above $2,700 after its rejection near $2,800.
ETF inflows do not guarantee that Ethereum will rise. However, sustained positive flows show that investors continued adding exposure to ETH during the recent price recovery.
On-Chain Data Adds Another Signal
Ethereum’s recent price action is also being watched alongside changes in trading volume and the 365-day market-value-to-realized-value (MVRV) ratio.
The seven-day and 30-day trading-volume averages have moved closer together. Similar setups appeared before several previous Ethereum rallies, although the bullish crossover itself has not yet occurred.
The 365-day MVRV ratio has also moved above zero. The metric compares Ethereum’s market value with the estimated cost basis of coins acquired over the previous year.
Earlier moves above zero were followed by stronger Ethereum rallies, with some eventually reaching the $4,000 area. However, the historical sample is limited, so the indicator alone cannot confirm that another major rally has started.
Ethereum Price Holds Above Key Moving Averages
Ethereum was trading around $2,650 on September 28, keeping the price above several important exponential moving averages.
The 50-day, 100-day and 200-day EMAs are positioned between roughly $2,260 and $2,430. ETH remaining above this group keeps the broader recovery structure intact, even though the latest rally has slowed.
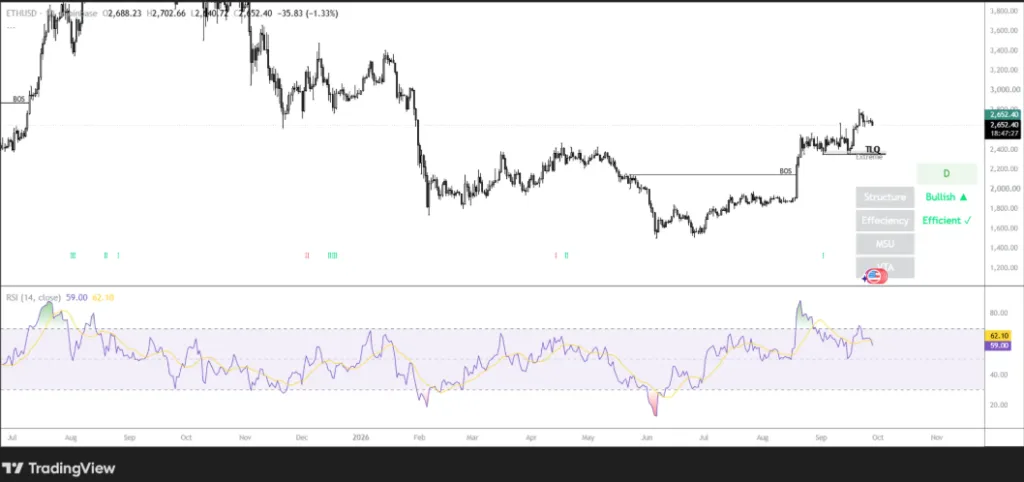
Momentum indicators also present a mixed picture.
Ethereum’s relative strength index (RSI) is around 58. That points to positive momentum without showing an overbought reading. Meanwhile, the MACD has turned slightly negative, suggesting that short-term momentum has weakened.
For now, the indicators show a market that has lost some momentum rather than one that has confirmed a broader reversal.
$2,500 Becomes a Key Ethereum Price Support
The $2,500 area is now an important level for ETH.
A move above this zone would allow Ethereum to continue consolidating after the rejection at $2,800. If the price falls below it, traders may turn their attention to the 50-day EMA near $2,425.
Further support sits around the 100-day EMA near $2,265 and the 200-day EMA near $2,259.
A sustained move below that moving-average cluster would weaken the current technical structure and could bring the $2,000 area back into focus. A deeper structural support level has been identified near $1,385.
Can Ethereum Reach $3,000?
For Ethereum, $2,800 remains the immediate resistance level to watch. A sustained break above that area would put the psychologically important $3,000 level back in focus. Until then, ETH remains caught between resistance near $2,800 and support around $2,500.
The combination of continued ETF inflows, improving on-chain readings and ETH’s position above its major moving averages is keeping the $3,000 target on traders’ radar. At the same time, the negative MACD and recent rejection show that Ethereum still needs fresh buying momentum to move higher.
For now, the key levels are clear: $2,800 on the upside and $2,500 on the downside.
ALSO READ: Why Is Ethena (ENA) Up Over 100% While Bitcoin Slides?
DISCLAIMER:
This article reflects the author’s views and is provided for informational purposes only. While we strive for accuracy, the publisher does not guarantee that all information is complete or current. Readers should verify important information and consult appropriate sources before making decisions based on this content.
About the Author