


- Ethereum stays above $3,900, showing a healthy consolidation phase despite cooling market activity.
- On-chain signals and technical structure suggest continued bullish potential.
Ethereum continues to demonstrate resilience despite broader market cooling, maintaining its bullish structure and steady long-term trend. After a week of consolidation, ETH remains comfortably above $3,900, suggesting that the second-largest cryptocurrency is preparing for its next potential breakout phase.
Ethereum Maintains a Solid Position
At the time of writing, Ethereum trades at $3,976, marking a 2.3% daily gain. Over the past week, the asset has fluctuated between $3,709 and $4,080, maintaining stability despite reduced market activity. Although ETH remains about 19% below its all-time high of $4,956, analysts note that it is holding well above its fair-value zone — a positive sign for long-term holders.
According to CryptoQuant analyst TeddyVision, Ethereum remains “above fair value but cooling from the top.” The cryptocurrency continues to trade well above its realized price of around $2,300, which typically serves as a strong support level during bearish phases. This shows that the market remains healthy, even as short-term activity slows.
Ethereum’s MVRV ratio of 1.67 suggests that holders are, on average, 67% in profit, indicating confidence without signs of market overheating. The recent pullback before the upper realized price band near $5,300 signals natural consolidation — not a reversal.
On-Chain Data Reflects Mild Caution
Despite Ethereum’s stable structure, on-chain data hints at short-term selling pressure. Exchange netflows have shifted from negative to positive, rising from -57,000 ETH to +7,000 ETH within a week. Nearly half of this movement came from Binance, where inflows turned positive, suggesting that some investors may be positioning to sell.
Analyst CryptoOnchain observed that while this trend is not alarming, a continued rise in exchange inflows could indicate mild caution among traders, especially as overall trading volume fell by 15.4% in 24 hours.
Technical Indicators Support Long-Term Bullishness
Ethereum’s technical indicators show a neutral short-term outlook but a strong long-term uptrend. The 10-day moving averages signal buying strength near $3,900, while the 200-day EMA at $3,577 confirms that the broader trend remains bullish.

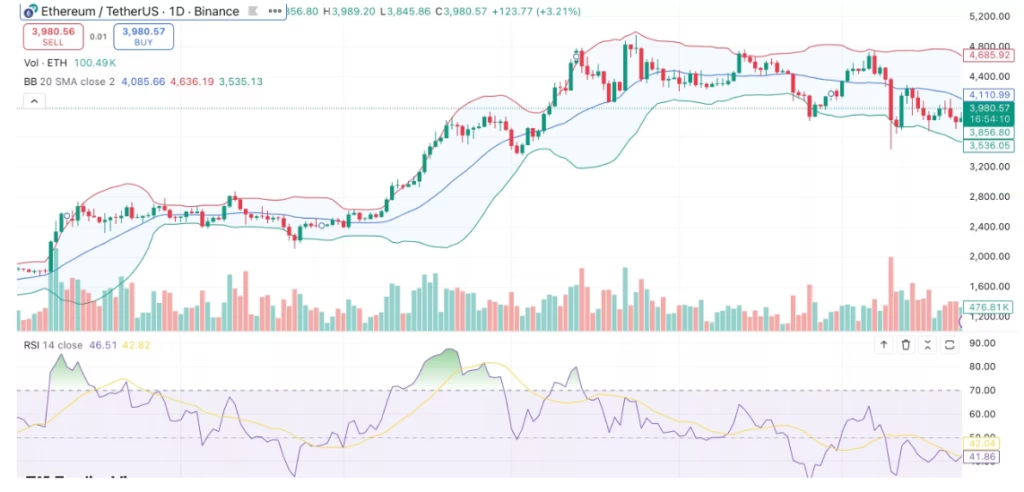
If Ethereum sustains support above $3,900 and breaks $4,100, the next targets could lie between $4,500 and $4,800. However, a drop below $3,700 could open the door to $3,400 or even $3,000.
DISCLAIMER:
The views and opinions expressed herein are solely those of the author or advertiser and do not necessarily reflect the views of the publisher. The publisher does not endorse or guarantee the accuracy of any information presented in this article. Readers are encouraged to conduct further research and consult additional sources before making any decisions based on the content provided.