

- Ethereum is trading above $4,600 despite a recent dip, with prediction markets giving strong odds for a rally to $5,000 by month-end.
- Technical analysis shows key support at $4,631 and resistance near $4,720, though inflation data poses potential risks.
Ethereum (ETH) is holding steady above $4,600 even after a 2.5% drop in the last 24 hours, triggered by hotter-than-expected inflation data from the latest Producer Price Index (PPI) report. While the short-term correction has cooled excitement from recent multi-year highs, sentiment in prediction markets suggests traders are still betting big on a rally by the end of August.
Prediction Markets Bet on $5,000 ETH
On Polymarket, participants see a 64% chance of Ethereum reaching $5,000 before August 31, while 90% believe it will at least hit $4,800. The optimism is even stronger for all-time highs, with an 87% probability on Polymarket and 92% on Kalshi. More ambitious targets are also in play — a 31% chance for $5,400 and an 18% shot at $5,800 by month-end.
Key Technical Levels to Watch
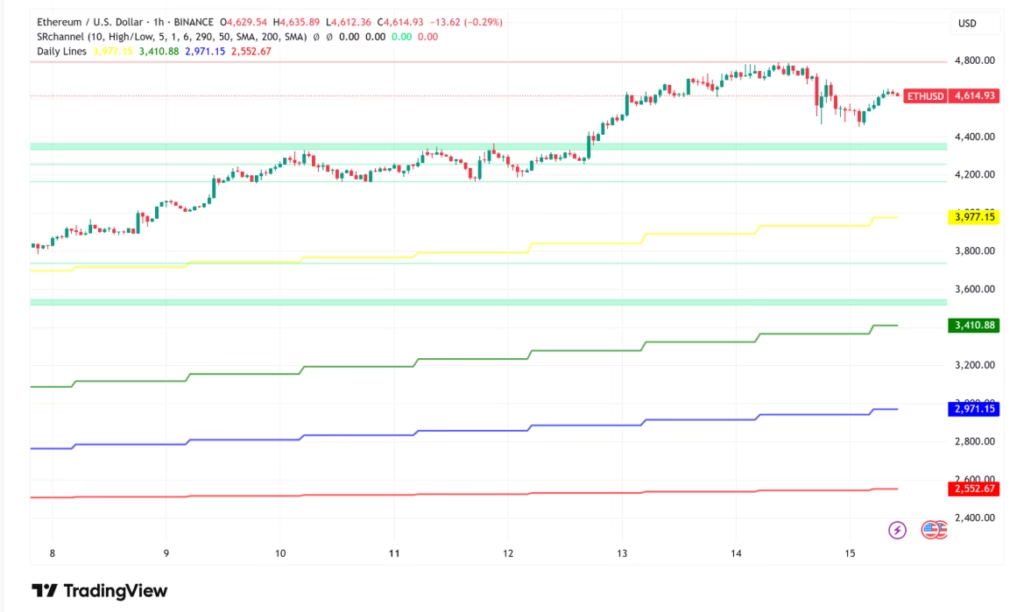
From a technical perspective, Ethereum faces a crucial test at $4,631, a level highlighted by trader Rekt Capital as the gateway to further upside. Turning this level into solid support could set ETH on a path toward price discovery. Failure to hold it could trigger a pullback toward $4,000 or even $3,750.
Currently, ETH is supported at $4,480, the 50% Fibonacci retracement from its latest rally between $4,170 and $4,782. The price is trading above both $4,550 and the 100-hourly Simple Moving Average, with a trendline near $4,500 providing additional support. Resistance levels are lined up at $4,640, $4,680, and $4,720, with a breakout above $4,720 potentially leading to $4,780, $4,880, and the psychological $5,000 mark.
Risks That Could Stall the Rally
Despite the bullish setup, macroeconomic headwinds remain a concern. The recent PPI inflation surprise has already pressured prices, and further negative economic data could weigh on cryptocurrencies. Block_Diversity, a pseudonymous analyst, notes that a dip into the $4,000-$4,400 demand zone remains possible before another upward push.
The hourly MACD shows fading strength in the bullish zone, though the RSI staying above 50 suggests that buyers still have the upper hand. Key support levels to monitor are $4,500, $4,400, and $4,315 — with deeper corrections possible if these fail.
Ethereum’s price path for the rest of August appears to hinge on its ability to maintain support above $4,631 and break through $4,720 resistance. If prediction markets are right, the next few weeks could bring a test of $5,000 and potentially new all-time highs.
ALSO READ:Pi Network Price Analysis Shows Falling Wedge with 154% Upside Ahead
DISCLAIMER:
The views and opinions expressed herein are solely those of the author and do not necessarily reflect the views of the publisher. The publisher does not endorse or guarantee the accuracy of any information presented in this article. Readers are encouraged to conduct further research and consult additional sources before making any decisions based on the content provided.


