

- Ethereum fell 3% on August 21 despite $287 million in ETF inflows, as liquidity and market sentiment outweighed demand.
- Analysts highlight key resistance at $4,388 and support near $4,150, with short-term volatility still dominating ETH’s price action.
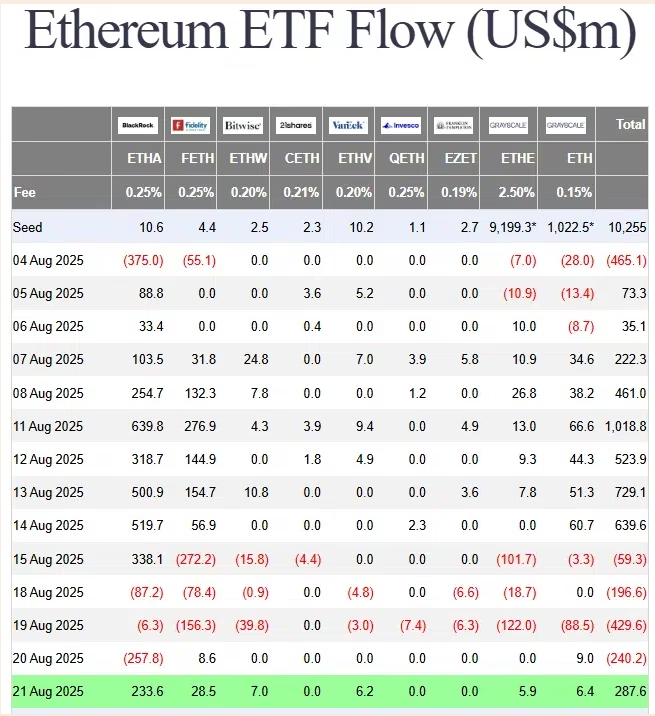
Ethereum [ETH] surprised traders on August 21 with a 3% decline, even as it recorded $287 million in ETF inflows. The event highlighted how short-term price action often reacts more to liquidity and sentiment than to ETF demand alone.
Ethereum Market Moving Against Expectations
Ethereum opened trading at $4,336 before falling to $4,225 by the end of the day. Bitcoin [BTC] also mirrored this weakness, slipping 1.55% on the same date. At first glance, ETH’s price decline appeared to contradict the strong inflow of funds into Ethereum spot ETFs.
However, recent data paints a more complex picture. According to Farside Investors, Ethereum ETFs faced outflows of $925.7 million between August 15 and August 20. These heavy outflows followed a bullish streak earlier in the month when inflows peaked at $1.018 billion on August 11.
Why ETF Inflows Don’t Guarantee Price Gains
While ETF inflows signal buying demand, they are not the sole driver of Ethereum’s price direction. Whale movements, liquidity zones, and market sentiment frequently play a stronger role in shaping short-term trends.
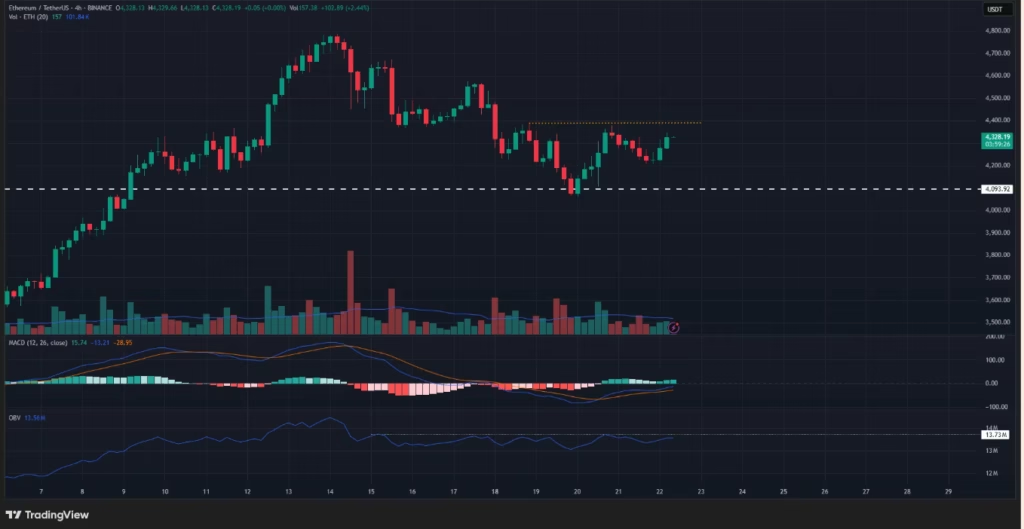
The 4-hour ETH/USDT chart showed persistent bearish structure, with resistance still holding at the $4,388 mark. On-balance volume (OBV) failed to create new highs, reflecting weak buying pressure. At the same time, the MACD indicator hinted at fading bearish strength, though no clear bullish reversal has been confirmed.
Ethereum Liquidity Zones Dictating Price Action
Ethereum’s liquidation heatmap revealed two key areas of interest. The first, a stronger resistance zone, sits between $4,385 and $4,410. The second, a support zone, lies between $4,160 and $4,200.
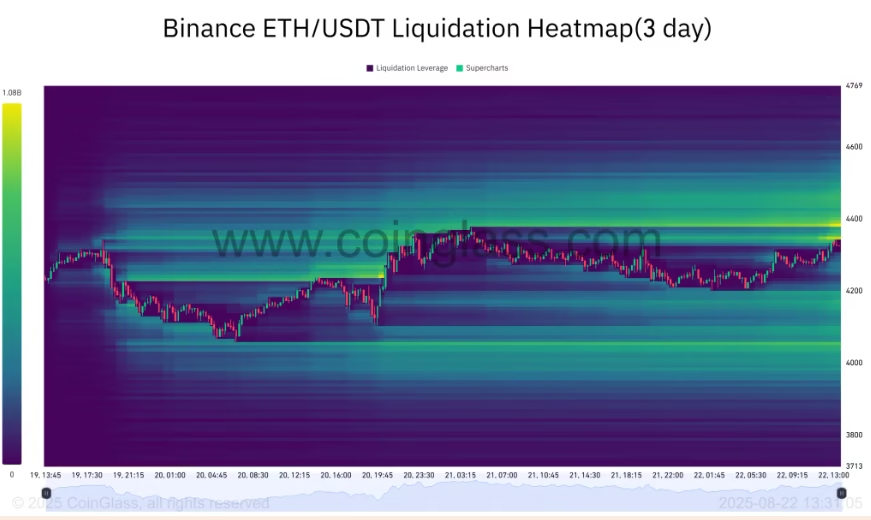
The drop on August 21 occurred after ETH tested overhead liquidity, which triggered a retreat toward the $4,200 area. Analysts note that short-term moves are often liquidity-driven, explaining why the decline followed despite significant ETF inflows.
Outlook for ETH Traders
Ethereum’s near-term price action suggests a cautious market environment where resistance remains unbroken, and volatility persists. While ETF inflows highlight continued institutional demand, traders should remain attentive to liquidity maps and resistance levels that continue to dictate ETH’s short-term direction.
For now, Ethereum’s resistance at $4,388 remains the key level to watch. A break above could open the door to renewed bullish strength, but failure to reclaim it may see ETH retest support zones near $4,150.
DISCLAIMER:
The views and opinions expressed herein are solely those of the author and do not necessarily reflect the views of the publisher. The publisher does not endorse or guarantee the accuracy of any information presented in this article. Readers are encouraged to conduct further research and consult additional sources before making any decisions based on the content provided.


