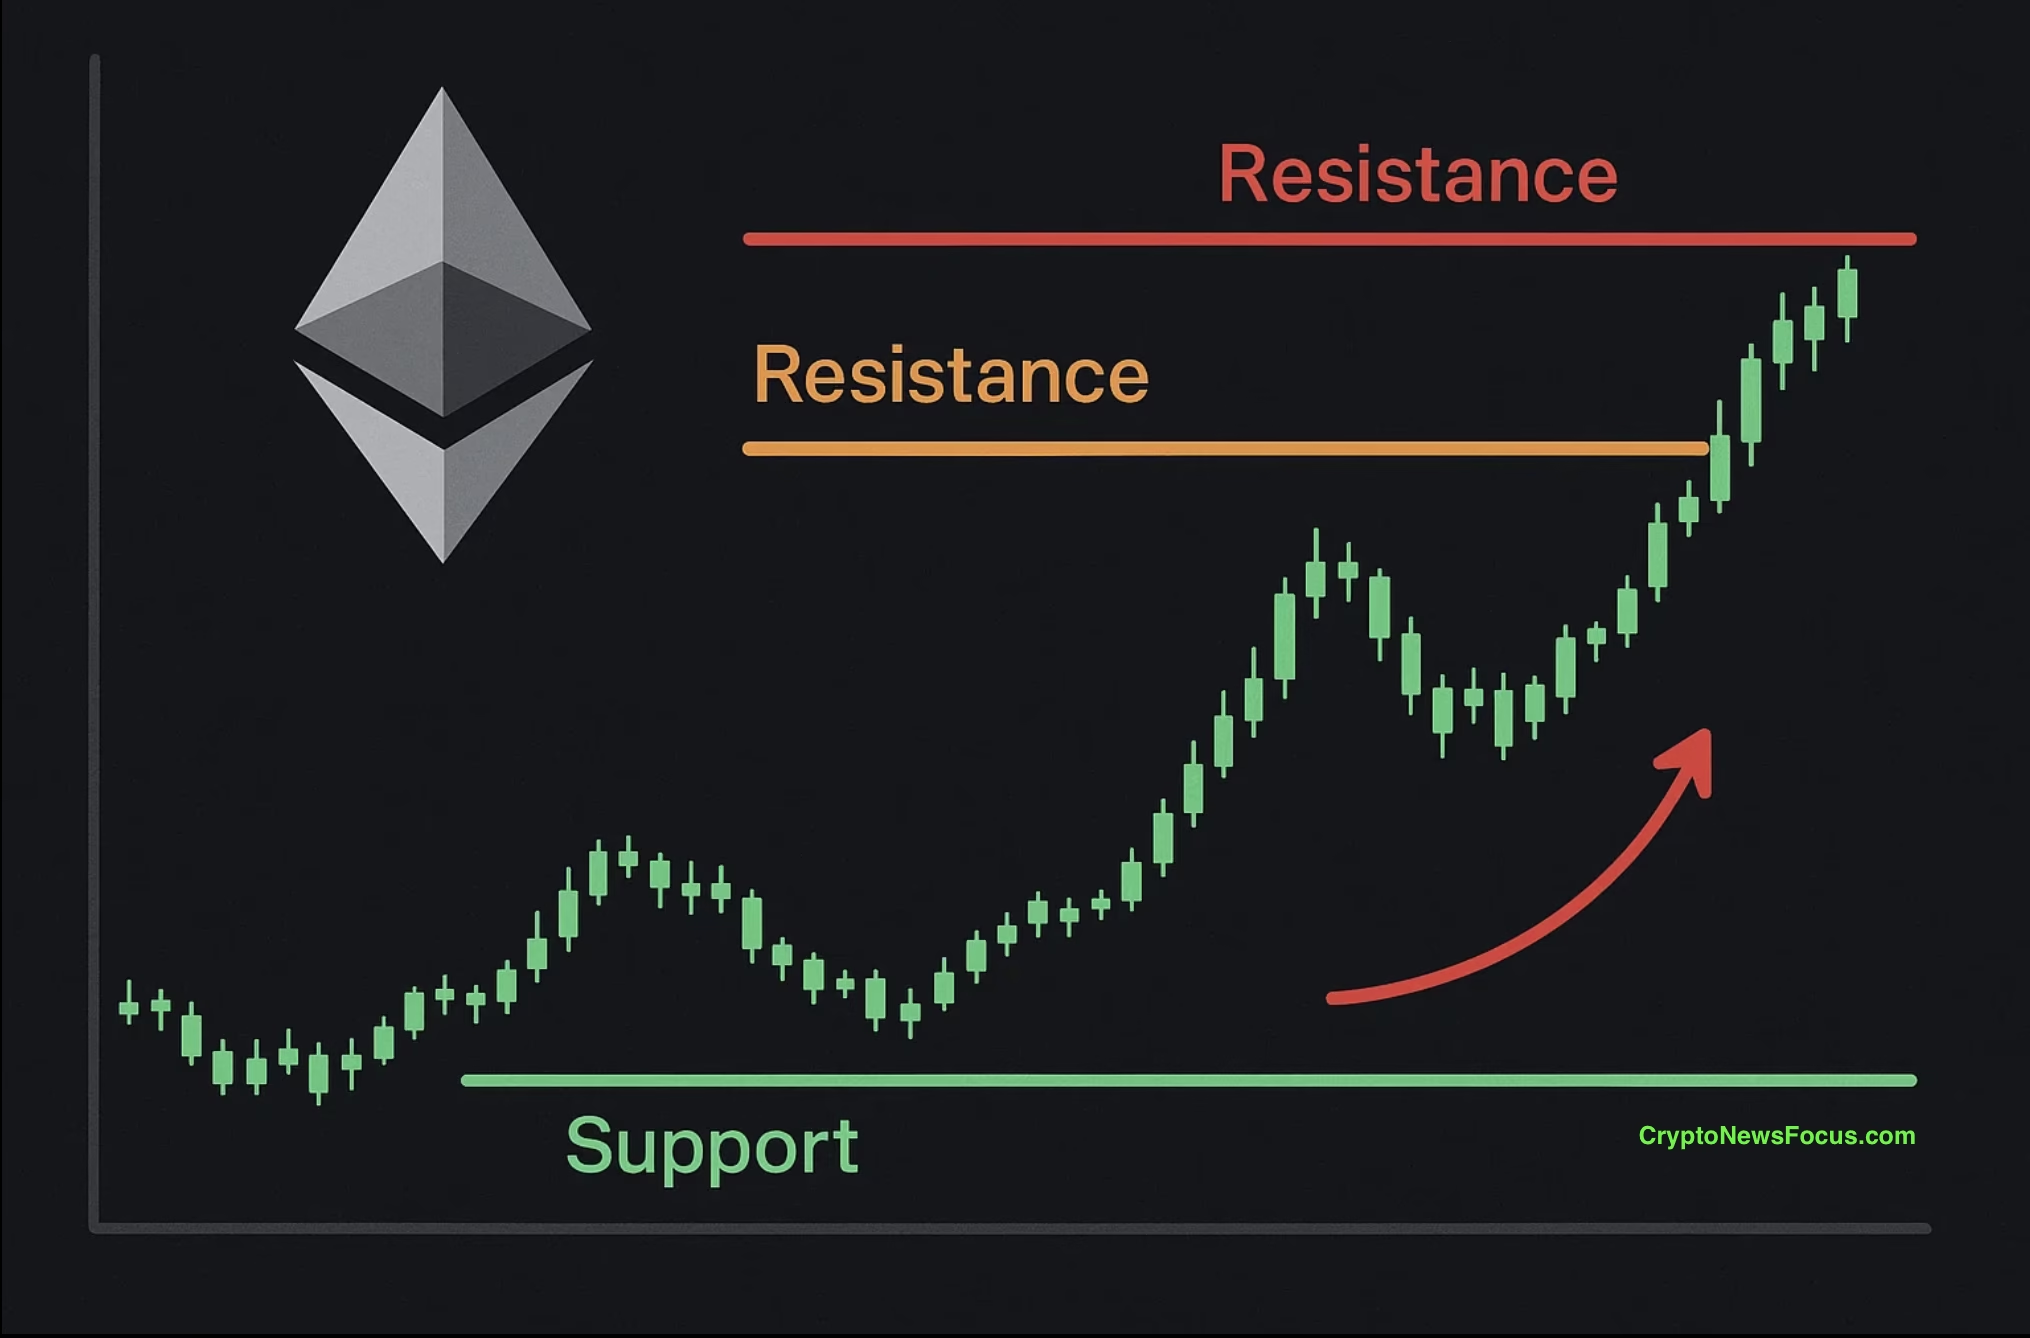
- Ethereum is at a make-or-break point below $2,500.
- A bullish breakout could see a rally to $2,700, but a bearish rejection risks a drop toward $2,000
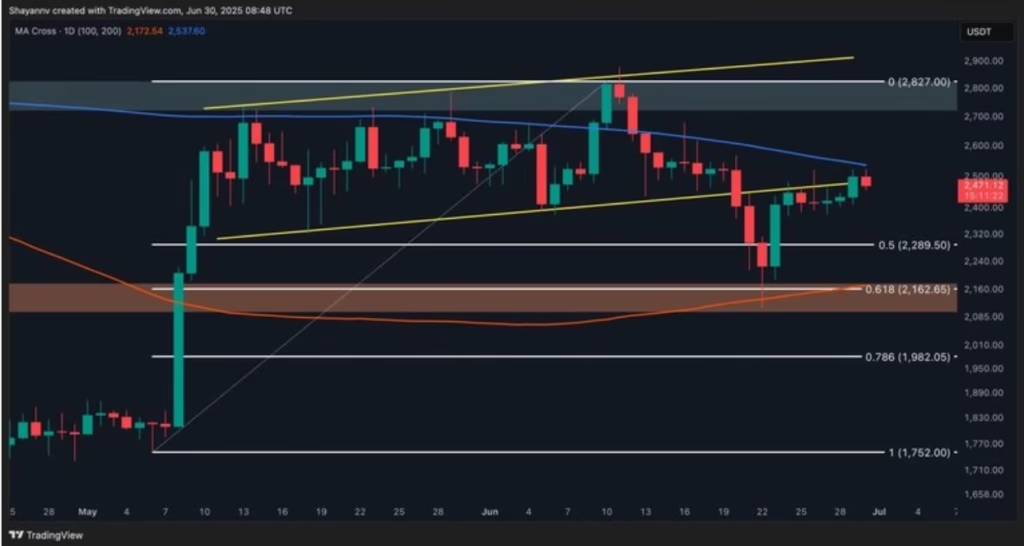
Ethereum is caught in a tight trading range, hovering just below the $2,500 resistance level. Despite a recent rebound from the $2,100–$2,200 Fibonacci support zone, the cryptocurrency remains pinned by major technical barriers. These include the 200-day moving average and the underside of a previously broken wedge pattern, both of which have halted upward movement.

Volatility has declined significantly, indicating a market in balance with neither bulls nor bears in control. For now, Ethereum’s path hinges on whether demand or supply takes the upper hand in the coming days.
Ethereum Technical Chart Signals Possible Breakdown
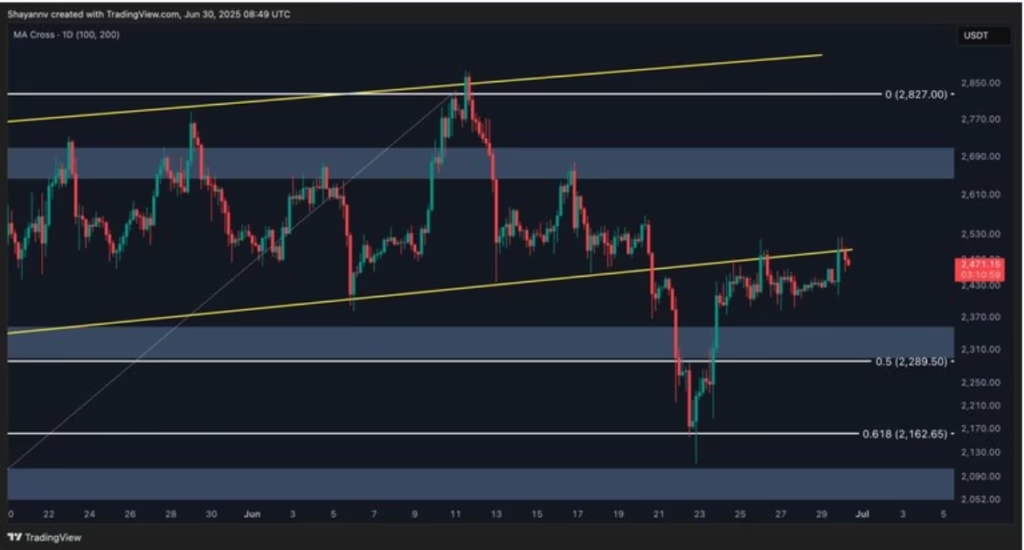
On the daily and 4-hour charts, Ethereum is showing signs of tightening consolidation. The $2,300 to $2,390 range has formed a fair value support zone, while resistance continues to hold at the broken wedge’s lower edge.

More importantly, a potential head and shoulders pattern is beginning to emerge on lower timeframes. If confirmed, this could suggest a bearish move is imminent, with ETH potentially revisiting the $2,000 psychological support level. Traders are closely watching for a breakout, as it will likely dictate the next major move.
Liquidity Heatmap Shows a Magnet at $2.5K
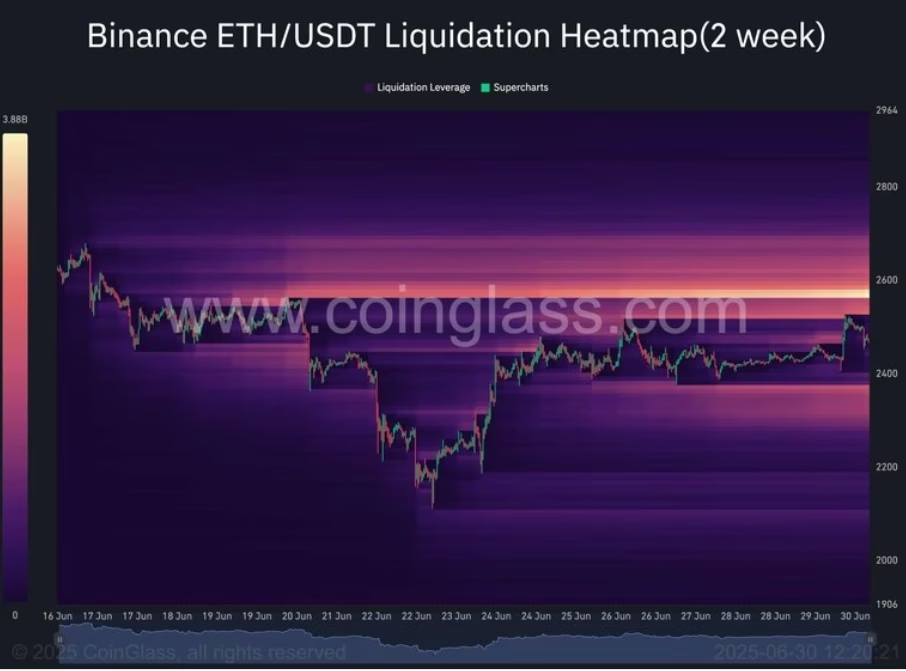
Sentiment analysis of the Binance liquidation heatmap highlights a dense liquidity cluster just above the $2,500 mark. These areas often attract price action, driven by institutional traders seeking efficient execution in highly liquid zones. A break above this level could trigger a short squeeze and push ETH toward $2,700 quickly.

However, that same cluster also indicates heavy selling pressure, making $2,500 a critical resistance level. The battle between buyers and sellers is intensifying, and any decisive move above or below the current zone could set the tone for Ethereum’s next trend.
Ethereum is at a make-or-break point below $2,500. A bullish breakout could see a rally to $2,700, but a bearish rejection risks a drop toward $2,000
ALSO READ:How to Bridge Ethereum & NFTs to Polygon—Complete Guide
DISCLAIMER:
The views and opinions expressed herein are solely those of the author and do not necessarily reflect the views of the publisher. The publisher does not endorse or guarantee the accuracy of any information presented in this article. Readers are encouraged to conduct further research and consult additional sources before making any decisions based on the content provided.


