


- Ethereum fell below key support after breaking a bearish trend line, signaling growing selling pressure in the market.
- The price is now consolidating at lower levels as recovery attempts remain weak.
Ethereum has come under renewed selling pressure after breaking below an important support zone. The price failed to hold above recent highs and has since moved into a weaker short-term structure. Market sentiment has shifted as sellers continue to dominate intraday movement.
Ethereum Breaks Below $2,250 Support
Ethereum started a fresh downside move after failing to stay above the $2,250 level. The price dropped below $2,220 and $2,200, confirming increasing bearish pressure.
The decline also pushed ETH under a bullish trend line that had been supporting price action near $2,210. This breakdown signaled weakening buyer strength and allowed sellers to drive the price lower toward $2,176.
Ethereum is now trading below the 100-hour simple moving average, showing that short-term momentum remains weak.
Price Stabilizes Above $2,175
After the decline, Ethereum found temporary stability above the $2,175 level. The market is now consolidating as traders assess whether a recovery or another drop will follow.
Price action remains below the 23.6% Fibonacci retracement level of the recent move from $2,329 to $2,175. This indicates that any recovery attempt is still fragile.
Buyers are attempting to defend the $2,175–$2,140 support area, which remains critical in the short term.
Resistance Levels Hold Back Recovery
Immediate resistance is seen at $2,210, followed by a stronger barrier at $2,235. A move above these levels is necessary for any meaningful recovery attempt.

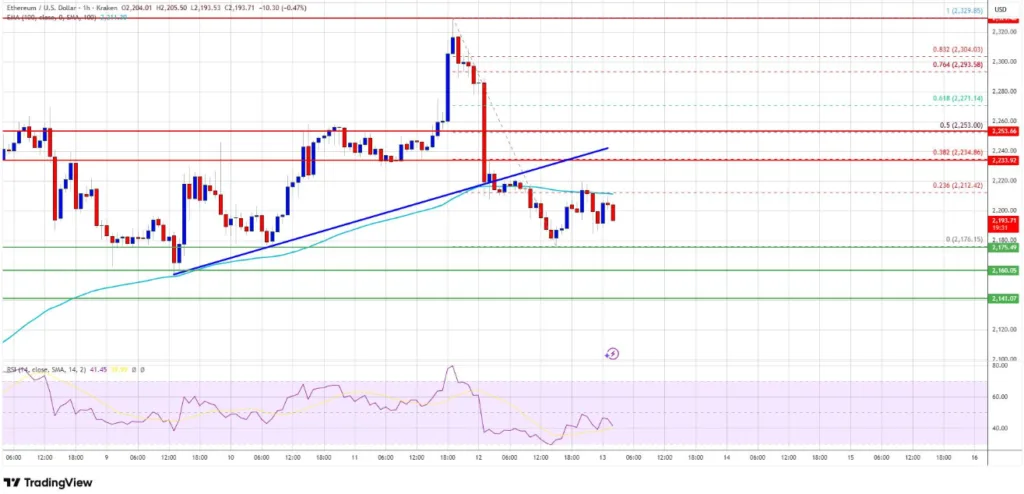
The most important resistance sits at $2,250, which aligns with the 50% Fibonacci retracement level. A breakout above this zone could shift momentum back toward buyers.
If Ethereum manages to clear $2,250, the next targets would be $2,290, $2,320, and potentially $2,350 in the near term.
Risk of Further Decline Remains
If Ethereum fails to break above $2,235, bearish pressure could return. Immediate support is located at $2,175, followed by the key $2,140 zone.
A breakdown below $2,140 could trigger a deeper correction toward $2,110. Further losses may expose $2,060, with major support near $2,020.
Technical Outlook
Indicators still favor sellers in the short term. The hourly MACD remains in the bearish zone, while the RSI is below 50, indicating weak momentum.
Ethereum remains under pressure after losing key support levels. A recovery will require a clear break above $2,235 and $2,250. Until then, the market outlook stays cautious with risk tilted toward further downside.
ALSO READ: XRP Market Holds in Balance as Supply Drops and Leverage Stays Flat
DISCLAIMER:
The views and opinions expressed herein are solely those of the author and do not necessarily reflect the views of the publisher. The publisher does not endorse or guarantee the accuracy of any information presented in this article. Readers are encouraged to conduct further research and consult additional sources before making any decisions based on the content provided.