



- Litecoin price jumped 6% after Grayscale filed for a spot ETF.
- LTC remains bullish but shows overbought signals.
Litecoin price jumped more than 6% after Grayscale Investments filed with the U.S. SEC to convert its Litecoin Trust into a spot ETF. The filing triggered higher trading activity and renewed institutional interest in LTC.
Grayscale ETF Filing Drives Litecoin Activity
Grayscale filed on September 11, 2026, to convert the Grayscale Litecoin Trust into a spot ETF that would be listed on NYSE Arca. The move has added a fresh catalyst for Litecoin as trading activity and network transfers increased in late September.
Litecoin’s on-chain transfers approached $1 billion, while trading volume climbed above $900 million. Futures open interest also rose beyond $500 million, pointing to a sharp increase in market activity around LTC.
The price move has attracted different views from market analysts. Anton Kharitonov of Traders Union said the rally appears largely driven by the ETF news and warned that the move could lose strength if the news-driven buying fades.
Viktoras Karapetjanc, also of Traders Union, pointed to Litecoin’s strong market structure and increased on-chain activity as signs that the bullish trend remains intact. Market strategist Sholanke Dele, however, highlighted the risk of a retracement after the rapid rise in price and trading activity.
Litecoin Price Holds Above Major Moving Averages
Litecoin price is trading above its 20-day, 50-day and 200-day moving averages at $56.44, $51.27 and $50.66, respectively. This setup shows that LTC remains above key short-, medium- and long-term trend levels.
Technical indicators also point to strong buying pressure. MACD and ADX continue to show buy signals, while Bull/Bear Power remains positive.
However, several momentum indicators have moved deep into overbought territory. Litecoin’s RSI stands at 82.7, while Stochastic RSI is at 100 and CCI is at 254.21. These readings suggest that the recent rally could face a pullback if buying pressure weakens.
LTC climbed to $71.19 after gaining $4.07, or 6.06%, during the session. The move followed an upside gap of about 7.21%, with intraday volatility reaching 2.96%.

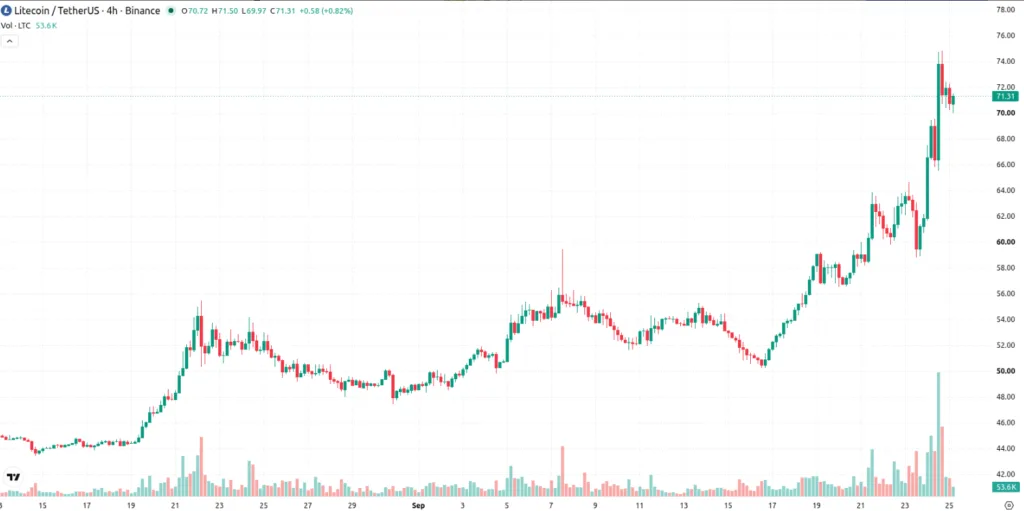
For the near term, $72.29 is the key resistance level, while $70.21 provides immediate support. A move above $72.29 could keep the current bullish structure in focus, while a loss of nearby support could increase the risk of a short-term retracement.
ALSO READ: VeChain Is Moving Into AI Agents — And It Could Change What the Blockchain Is For
DISCLAIMER:
This article reflects the author’s views and is provided for informational purposes only. While we strive for accuracy, the publisher does not guarantee that all information is complete or current. Readers should verify important information and consult appropriate sources before making decisions based on this content.