Skip to content
Crypto News Focus logo CNF_CRYPTO_NEWS_FOCUS_LOGO 8

Crypto News Focus

your day to day crypto news site

Primary Menu
  • Home
  • News
    • Bitcoin News
    • Ripple XRP news
    • Ethereum News
    • Cardano News
    • Shiba Inu News
    • Pi Network News
    • More
  • Analysis
  • PR Desk
  • About Us
  • General Policy & Privacy
  • Guides
    • Bitcoin Guides
    • Pi Network Guide
    • Cardano Guide
  • Politics
  • Tech
  • Home
  • News
  • Pi Coin Price Set to Surge, Says Wyckoff Theory and Chart Patterns
  • Analysis
  • News

Pi Coin Price Set to Surge, Says Wyckoff Theory and Chart Patterns

vivian 28 July 2025
PI COIN IMAGE
  • Pi Coin is currently in the Wyckoff Theory’s accumulation stage, signaling a potential price breakout soon.
  • Strong technical patterns suggest the token could rise above $1 and possibly reach $1.60.

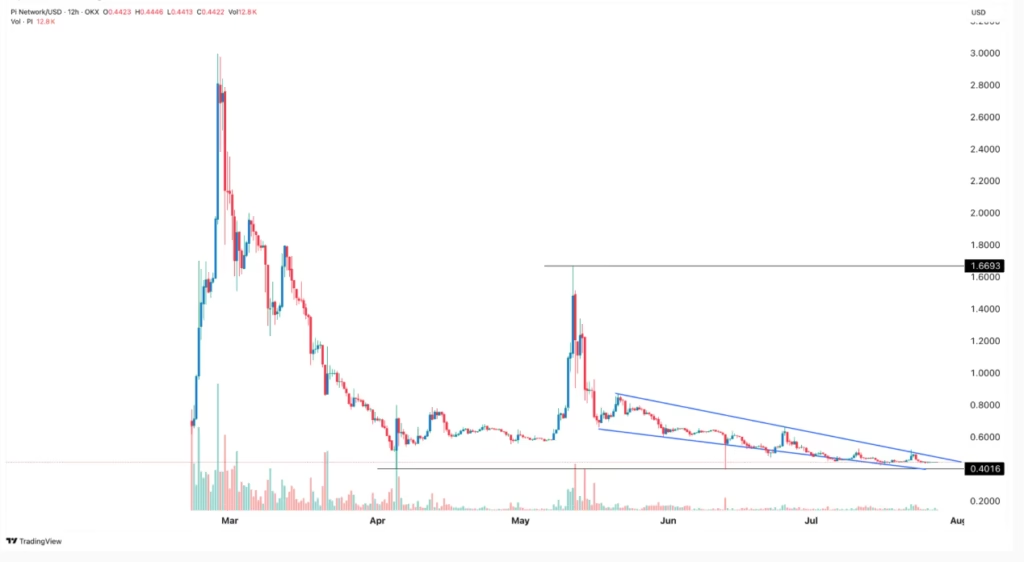
Pi Coin’s price has remained steady around $0.44 in recent months, even as Bitcoin and many altcoins saw big gains. This quiet period may be setting the stage for a major price rally soon.

Wyckoff Theory Signals a Potential Pi Coin Breakout

The Wyckoff Theory, developed over 90 years ago, explains how asset prices move in four stages. Pi Coin is currently in the first stage called accumulation. This phase features low trading volume, price consolidation, and some selling pressure—exactly what we see in Pi Coin’s recent chart.

Between April and early May, Pi Coin went through this accumulation phase. After that, it entered the markup phase where prices rise due to increased buying and investor excitement. In May, Pi Network teased a big announcement from Pi Network Ventures, sparking FOMO (fear of missing out) among investors.

PINETWORK/ USD PRICE CHART FOR 12 HOURS PERIOD

This suggests Pi Coin could soon break out of its current range and start a strong upward move.

Bullish Technical Patterns Support Price Growth

Pi Coin’s price chart shows a powerful double-bottom pattern at about $0.40. This pattern is a well-known signal for a price reversal and often leads to gains. The two low points were in early April and early June.

Additionally, a falling wedge pattern is forming. This pattern has two descending trendlines that converge, often leading to a bullish breakout once they meet.

The Bollinger Bands, which measure price volatility, have narrowed recently. This narrowing signals that a short squeeze and price spike could happen soon.

If Pi Coin breaks above $1, the next key resistance level is around $1.60, based on the double-bottom pattern’s neckline.

What This Means for Pi Coin Investors

For those watching Pi Coin, these signs indicate a possible price surge in the near future. Moving from accumulation to markup could push the price to double or even triple. The Wyckoff Theory combined with strong chart patterns make Pi Coin a promising opportunity.

ALSO READ:Pi Network KYC Checklist and 2FA Guide for Mainnet Access

DISCLAIMER:
The views and opinions expressed herein are solely those of the author and do not necessarily reflect the views of the publisher. The publisher does not endorse or guarantee the accuracy of any information presented in this article. Readers are encouraged to conduct further research and consult additional sources before making any decisions based on the content provided.

About the Author

vivian

Administrator

Vivian Njoroge is a seasoned crypto and blockchain news writer with a passion for decoding the complexities of the digital financial world. Armed with a keen eye for emerging trends and a knack for simplifying intricate concepts, Vivian brings a unique blend of expertise and enthusiasm to her writing. Her articles, characterized by clarity and depth, aim to keep readers abreast of the ever-evolving landscape of cryptocurrencies and blockchain technology.

View All Posts

Continue Reading

Previous: Metaplanet Increases Bitcoin Holdings to 17,132 BTC with New Purchase
Next: Why Ethereum Is Dominating the Crypto Space Right Now

Related Stories

POLKADOT IMAGE
  • Analysis

Polkadot Price Rises as Polkadot 2.0 Launch Approaches

Dennis Gatheca 9 September 2025
SOLANA IMAGE ON BLACK BACKGROUND
  • Analysis

Solana Price Eyes $260 After Key Support Zones Hold

Sean Williams 9 September 2025
DOGECOIN IMAGE AND SOME COINS BEHIND IT
  • Analysis

Dogecoin ETF Set to Launch September 11, Revolutionizing Meme Coin Investing

Jane Kariuki 9 September 2025

For general inquiries, please email us at Info@cryptonewsfocus.com

Crypto news focus is your day-to-day crypto news site. Get all the latest News and trends in the crypto, blockchain, and DeFi space. For more info and inquiries, reach out via email at info@cryptonewsfocus.com

You may have missed

POLKADOT IMAGE
  • Analysis

Polkadot Price Rises as Polkadot 2.0 Launch Approaches

Dennis Gatheca 9 September 2025
SOLANA IMAGE ON BLACK BACKGROUND
  • Analysis

Solana Price Eyes $260 After Key Support Zones Hold

Sean Williams 9 September 2025
DOGECOIN IMAGE AND SOME COINS BEHIND IT
  • Analysis

Dogecoin ETF Set to Launch September 11, Revolutionizing Meme Coin Investing

Jane Kariuki 9 September 2025
HEDERA HBAR IMAGE
  • Analysis

Hedera HBAR Price Prediction: Could 6,375 HBAR Reach $63K by 2026

Cal Evans 9 September 2025

Social Media

Crypto News Focus © All rights reserved | MoreNews by AF themes.
Go to mobile version
We use cookies to ensure that we give you the best experience on our website. If you continue to use this site we will assume that you are happy with it.