


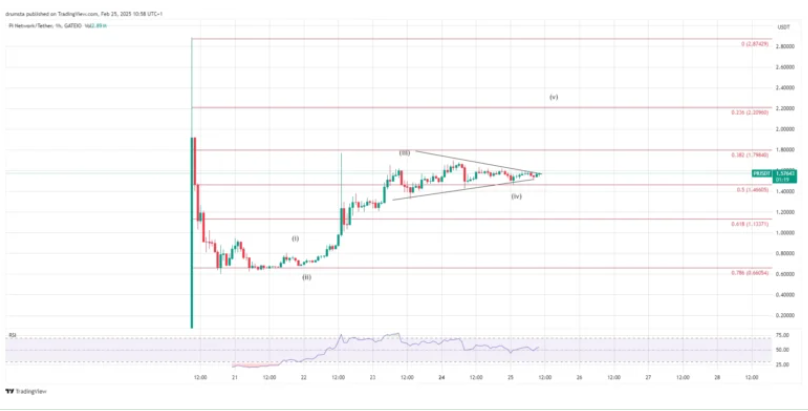
- Pi Coin (PI) is forming a symmetrical triangle pattern, signaling a potential bullish breakout, with key resistance at $1.79 and possible targets up to $1.90.
- However, failure to hold above $1.50 could lead to a bearish reversal toward $1.46 or lower.
Pi Network (PI) is on the verge of a significant move as it forms a symmetrical triangle pattern on multiple time frames. With the price consolidating near key Fibonacci levels, traders are closely watching for a bullish breakout. Technical indicators, including Elliott Wave analysis and RSI levels, suggest that PI may be preparing for a strong upward push.
A Symmetrical Triangle Poised for Breakout
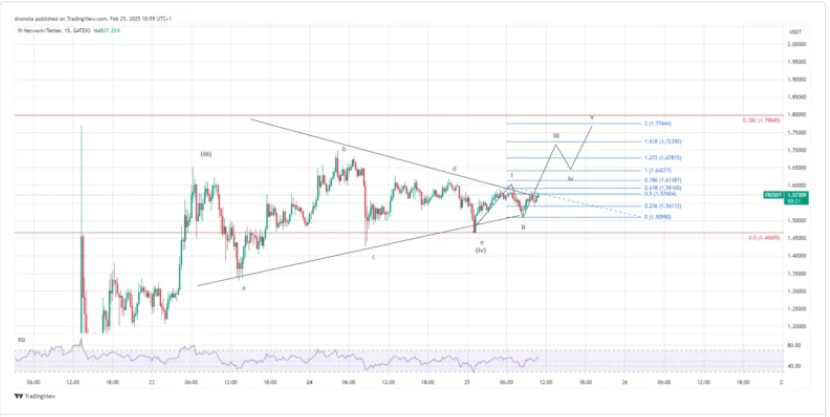
Pi Coin has been trading within a symmetrical triangle, a pattern that typically signals a pending breakout. The asset’s 1-hour and 15-minute charts indicate that it has completed a corrective phase, setting the stage for a potential bullish impulse wave. If PI successfully breaks above the triangle’s upper boundary, it could mark the beginning of wave (v) in the Elliott Wave count, further fueling bullish sentiment.

Fibonacci retracement and extension levels provide crucial insights into potential price targets:
- Support Levels: PI is holding above $1.46, a key structural support at the 0.5 Fibonacci retracement level. A drop below this could invalidate the bullish setup and push prices toward $1.13 (0.618 retracement level).
- Resistance Levels: Immediate resistance stands at $1.64 (1.0 Fibonacci extension), followed by $1.72 (1.618 Fibonacci extension) and major resistance at $1.79.
A decisive move above $1.79 could see PI targeting $1.87 to $1.90, marking a significant bullish extension.
The Relative Strength Index (RSI) remains neutral, suggesting that PI is neither overbought nor oversold. This balanced momentum increases the probability of a breakout, as price action remains above key support levels.
If PI manages to sustain momentum and break past resistance at $1.64 and $1.72, it could pave the way for a rally toward $1.87 and beyond. However, failure to maintain support above $1.50 could see a retest of $1.46, increasing the risk of a bearish scenario.

Key Takeaways:
- Bullish scenario: A breakout above $1.79 could push PI toward $1.87 and possibly higher.
- Bearish scenario: Failure to hold above $1.50 may signal a downward continuation toward $1.46 or lower.
- Current outlook: Neutral-to-bullish as RSI supports momentum without overextension.
Traders and investors should keep a close watch on these key levels as PI prepares for a decisive move. A confirmed breakout could lead to substantial gains, making it an exciting time for Pi Coin enthusiasts.