



- Pi Network trades above $0.20 after a 20% weekly gain driven by strong retail demand.
- Technical indicators show buyers remain in control.
Pi Network is showing renewed strength in the crypto market, with its price hovering around $0.20 after extending gains for five consecutive days. The token has climbed roughly 20% this week, signaling a notable recovery after previous downward pressure.
The recent rise appears to be driven largely by strong retail demand, with market data pointing to a growing number of investors accumulating the token rather than selling it.
Rising Retail Demand Reduces Selling Pressure
Recent data from PiScan reveals a significant drop in Pi tokens held on centralized exchanges. Over the past 24 hours, approximately 1.68 million PI tokens were withdrawn from exchanges. Such outflows typically indicate that investors are moving their assets into private wallets, which often reduces immediate selling pressure.

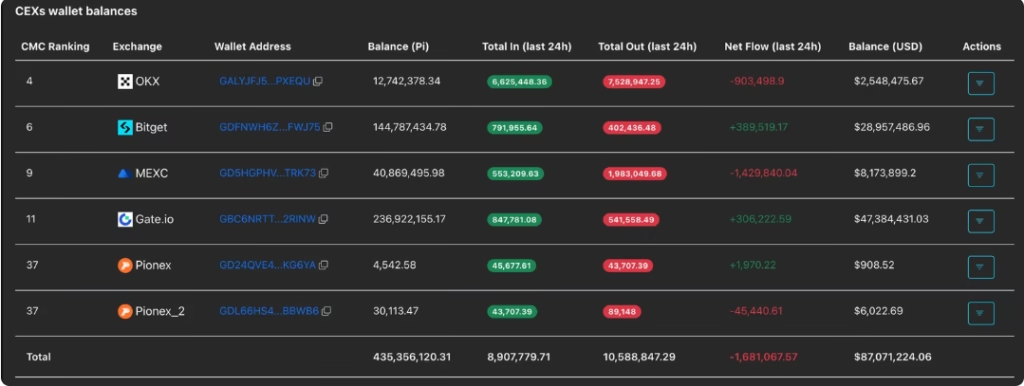
This shift in supply dynamics suggests that many retail participants are choosing to hold their tokens instead of trading them. Reduced exchange reserves can sometimes support price stability or even push prices higher when demand continues to increase.
Market observers also note that the recovery comes as the Pi community approaches Pi Day on March 14. Historically, important milestones for the network have coincided with increased interest and activity among users. A similar price recovery occurred shortly before the first anniversary of Pi Network’s Open Network launch on February 20.
Technical Indicators Signal a Bullish Setup
From a technical perspective, Pi Network appears to be testing an important resistance zone. The price is currently trading above a long-term descending trendline that previously connected major highs recorded in late August and November.
Holding above the 100-day Exponential Moving Average (EMA) near $0.1960 could confirm a breakout from the earlier downtrend. Such a move would strengthen the case for continued upward movement in the near term.
Momentum indicators also support the bullish outlook. The Moving Average Convergence Divergence (MACD) remains above its signal line and continues to print positive histogram bars, suggesting growing buying strength.

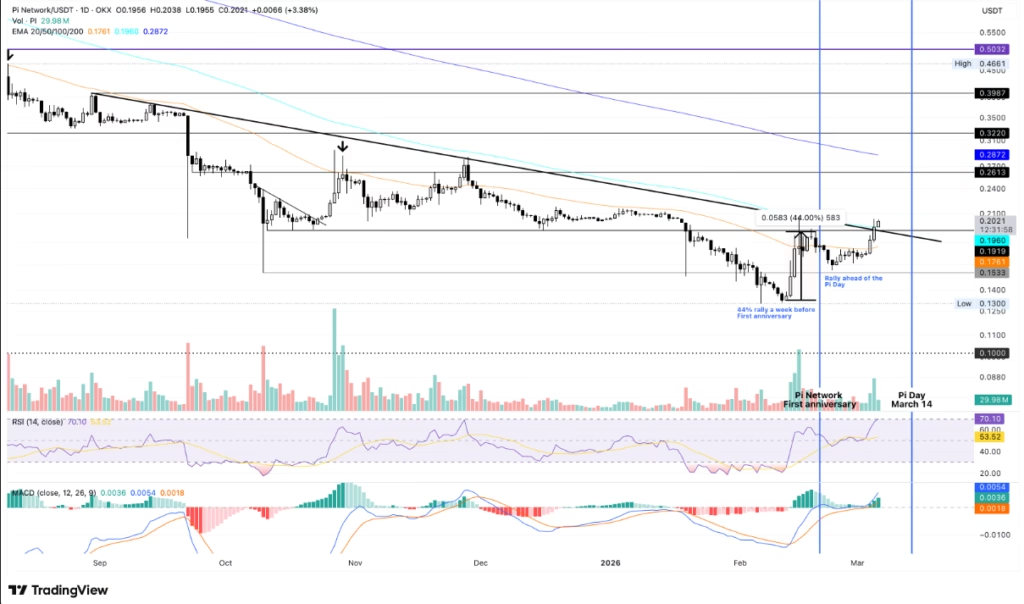
Meanwhile, the Relative Strength Index (RSI) is currently around 70. While this indicates strong buyer control, it also places the asset in overbought territory. In such situations, short-term consolidation or minor pullbacks can occur before the trend continues.
Key Support Levels to Watch
Despite the bullish outlook, analysts caution that maintaining support above the 100-day EMA is critical. If Pi Network falls below this level, the next key support lies near the 50-day EMA around $0.1761.
A deeper pullback could bring the price toward the October low near $0.1533. However, as long as strong retail demand continues and exchange reserves keep declining, the broader recovery trend may remain intact.
ALSO READ: Pi Network Launches Decentralized AI Computing With Its Global Node Network
Disclaimer:
This article is for informational and educational purposes only. It does not constitute financial, investment, or legal advice. Readers should conduct their own research or consult a professional before making any business or financial decisions.