



- Pi Network continues to face bearish pressure as it trades inside a descending channel, with the risk of falling below the $0.07 level.
- Technical indicators show early signs of stabilization, but PI needs to break key resistance levels to support a recovery.
Pi Network (PI) remained under pressure on Monday, falling more than 2% as weak sentiment across the crypto market continued to weigh on prices. Lower trader participation and a long-standing downtrend suggest PI could soon test new lows.
While a few technical indicators have improved slightly, buyers have yet to reclaim key resistance levels that would signal a stronger recovery.
Weak Risk Appetite Keeps PI Under Pressure
Investor confidence remained subdued at the start of the week. CoinMarketCap’s Fear and Greed Index stood at 34, showing that fear continues to influence trading decisions.

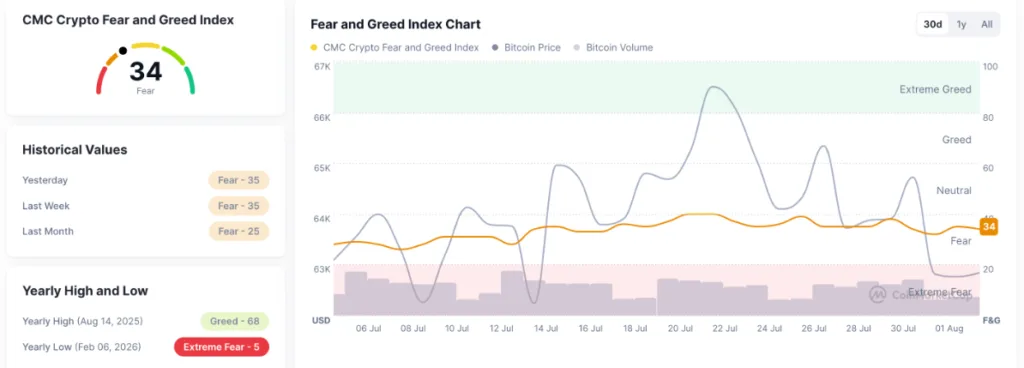
When traders become more cautious, demand for altcoins often falls. PI has been no exception, with the latest decline reflecting the broader weakness across the crypto market. Concerns following the recent Coldcard wallet hack have also added to the cautious mood.
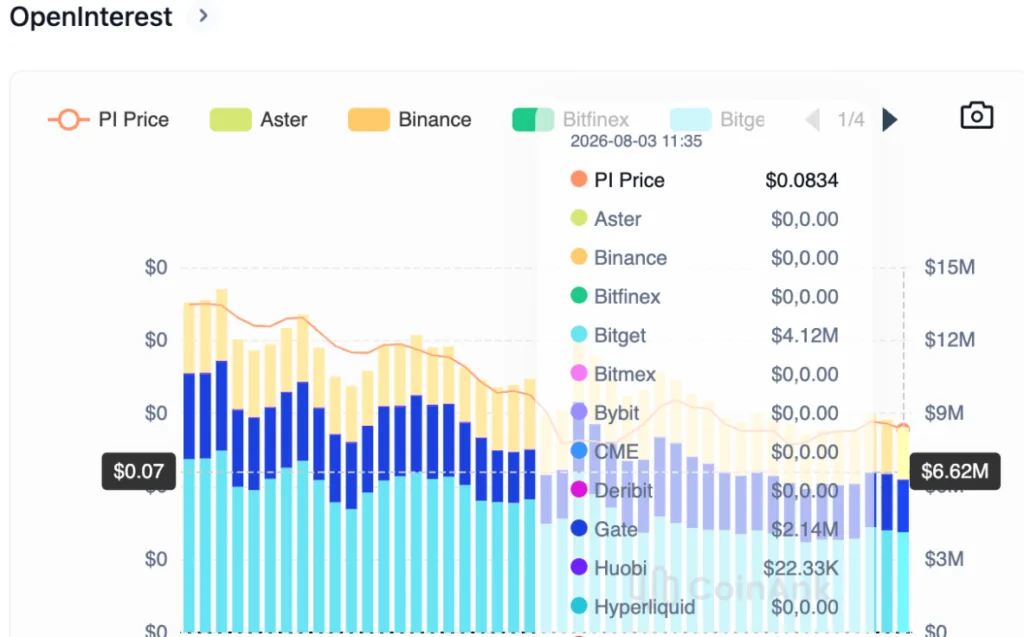
Derivatives data points to reduced trading activity. CoinAnk data shows PI futures Open Interest fell from $8.94 million on Saturday to $8.41 million on Monday. The decline suggests fewer traders are keeping positions open, reflecting weaker participation as the price continues to slide.

Pi Network Remains Inside a Descending Channel
The daily chart shows PI still trading inside a descending channel that has shaped its price action for months. Although the price held above $0.0800 on Monday, buyers have not done enough to change the overall trend.

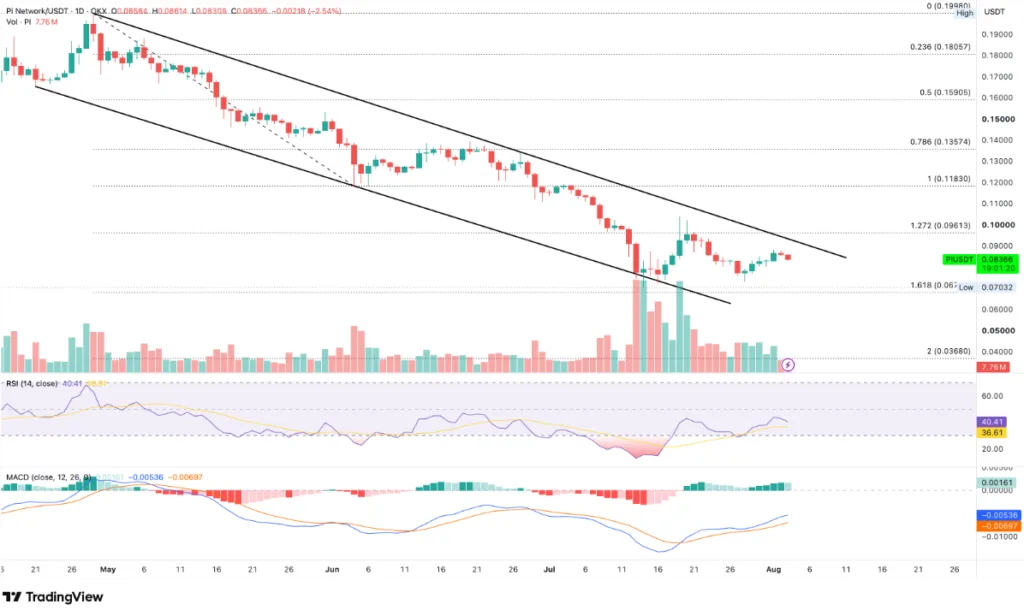
The first level to watch is $0.0910, where the upper boundary of the channel is located. A move above this level would indicate that buyers are regaining control after weeks of weakness.
Above that, $0.0961 marks the 127.2% Fibonacci extension and represents another important barrier. Clearing this level could allow PI to target $0.1183, the next major Fibonacci level.
Indicators Show the Decline Has Slowed
Although Pi Network remains in a downtrend, some indicators show that the recent decline has lost part of its intensity. The MACD indicator is holding above its signal line, suggesting that short-term buying activity has improved slightly after PI moved closer to oversold levels.
The RSI is currently around 40, recovering from deeper oversold conditions. This indicates that selling activity has slowed, but the indicator remains below the neutral 50 level, meaning buyers have not yet taken control of the trend.
For PI to confirm a recovery, the price needs to break above key resistance levels, especially the $0.0910 and $0.0961 zones. Without a move above these areas, the recent improvement in technical indicators may only represent a temporary pause rather than a trend reversal.
The descending channel remains intact, keeping the risk of a drop toward the $0.0679 support level and a possible new all-time low below $0.0700.
Pi Network Price Prediction
The key support level for PI sits at $0.0679, which matches the 161.8% Fibonacci extension and the previous low. A drop below this area could push PI into uncharted territory and create a new record low below $0.0700.
For buyers to regain control, PI needs to break above the $0.0910 resistance level. A move past this zone could reduce bearish pressure and open the way toward the next resistance near $0.0961.
Until PI breaks out of its current descending channel, the price remains vulnerable to further declines.
ALSO READ: Tether Reports $1.5B Q2 Profit as USDT Reaches New Supply Record
DISCLAIMER:
The views and opinions expressed herein are solely those of the author and do not necessarily reflect the views of the publisher. The publisher does not endorse or guarantee the accuracy of any information presented in this article. Readers are encouraged to conduct further research and consult additional sources before making any decisions based on the content provided.