- Bitcoin, Ethereum, and Ripple are at critical support levels, with potential declines if they fail to hold above key thresholds.
- However, breaking above resistance levels could invalidate bearish trends and trigger rallies.
As the cryptocurrency market continues to experience volatility, Bitcoin (BTC), Ethereum (ETH), and Ripple (XRP) are facing crucial support and resistance levels that could dictate their next moves. With Bitcoin struggling to maintain its position below the $60,000 mark, a bearish trend seems imminent unless key levels are reclaimed.
Bitcoin Price: Hovering Above Critical Support
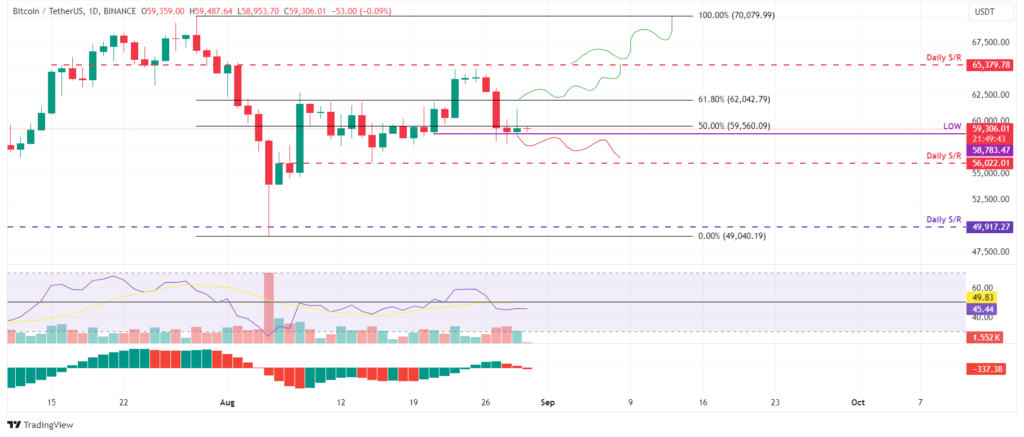
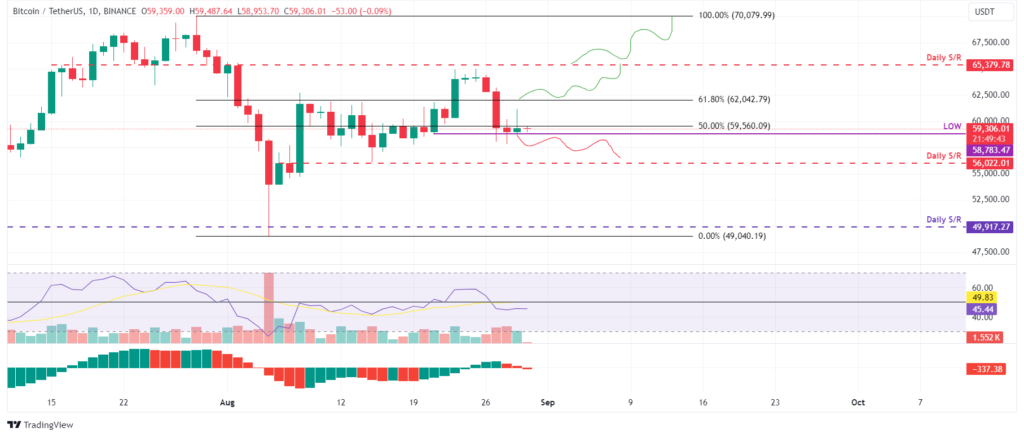
Bitcoin price is currently trading around $59,306, after facing rejection at the daily resistance level of $65,379 last Sunday. The cryptocurrency has since dropped by 8% and is now hovering just above a crucial support level at $58,783.
The Relative Strength Index (RSI) and the Awesome Oscillator (AO) are both showing signs of weak momentum, with the RSI slipping below its neutral level of 50 and the AO dropping below zero. If Bitcoin fails to hold above the $58,783 level and closes below it, a further decline of 4.5% could be on the horizon, with the next support level at $56,002.

On the flip side, should Bitcoin find support at $58,700 and manage to close above the 61.8% Fibonacci retracement level at $62,042, the bearish outlook could be invalidated, potentially leading to a 5.5% rally to retest the $65,379 resistance.
Ethereum Price: Facing Downward Pressure
Ethereum’s price is also showing signs of weakness after retesting its broken ascending trendline around $2,619. This trendline, which was formed by connecting multiple lows from early August, has now become a resistance barrier, with ETH trading slightly down by 0.4% at $2,516 as of Friday.

If Ethereum continues to face resistance at the $2,619 level, it could be poised for a 6% decline to retest the August 8 low of $2,327. The RSI and AO are both below neutral levels, further indicating bearish dominance.
However, if Ethereum can break above the $2,619 resistance and close above the $2,927 daily resistance level, the bearish thesis would be invalidated, potentially triggering an 11% rally to retest the weekly resistance at $3,236.
Ripple Price: Testing Key Support
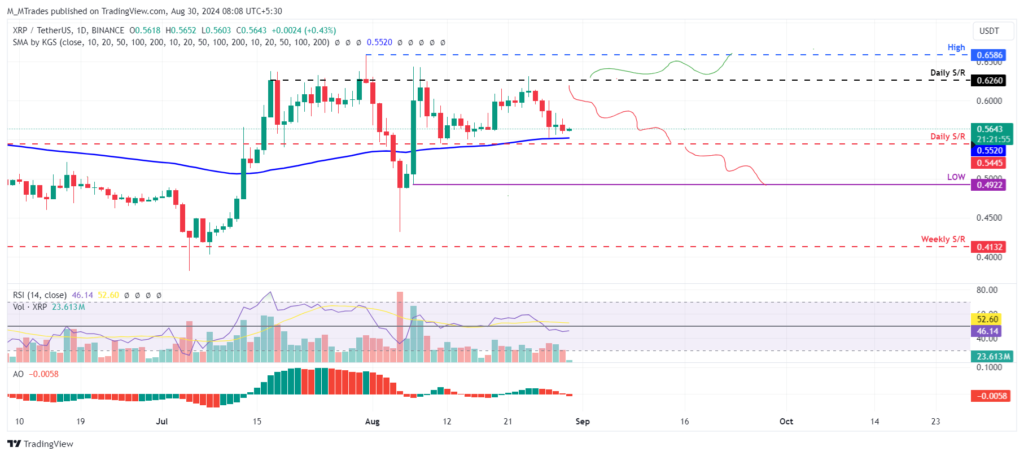
Ripple is trading slightly up by 0.4% at $0.564, finding support around the 200-day Exponential Moving Average (EMA) at $0.552 after being rejected by its daily resistance level of $0.626 on August 24.
If Ripple fails to hold above the 200-day EMA and closes below $0.544, a 10% decline could be in store, with the next target being the August 7 low of $0.492. The momentum indicators are also pointing to a bearish trend, with both the RSI and AO trading below their neutral levels.

However, a close above the $0.626 resistance level would create a higher high on the daily chart, potentially leading to a 5.3% rise to revisit the July 31 high of $0.658.
Bitcoin, Ethereum, and Ripple are at critical junctures. If key support levels fail to hold, we could see significant declines in the near term. Conversely, reclaiming crucial resistance levels could spark rallies, but the overall sentiment remains cautious as the bears seem to be in control.


