


- Solana price is recovering as retail demand strengthens, pushing SOL above its 50-day EMA despite weak ETF inflows.
- The next key test is the $81.50 resistance level, which could determine whether SOL continues toward higher targets.
Solana (SOL) is showing signs of recovery after rebounding from recent losses, with retail traders providing fresh support despite limited institutional activity. The price has moved back above a key technical level, but bulls still need to overcome major resistance before a stronger rally can develop.
Solana Gains Support From Retail Traders
SOL price climbed above its 50-day EMA at $76.82 after gaining about 4% in the previous session. The recovery comes as broader crypto market conditions improve, with easing inflation concerns in the United States helping revive interest in major altcoins.
Market data shows that retail participation has increased through Solana’s derivatives market. According to CoinGlass data, SOL futures open interest remained steady near $4.93 billion over the past 24 hours. Trading volume also increased by 15% to $6.90 billion, suggesting stronger market activity.

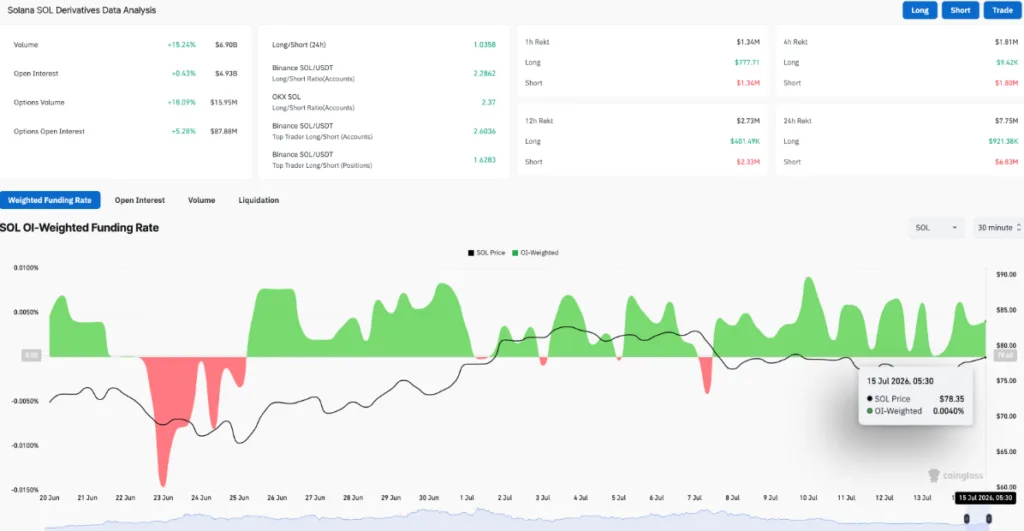
The funding rate for SOL futures stands at 0.0040%, showing that traders currently hold a slightly bullish outlook. Rising positions and positive funding rates indicate that retail traders are becoming more confident about a possible continuation of the recovery.
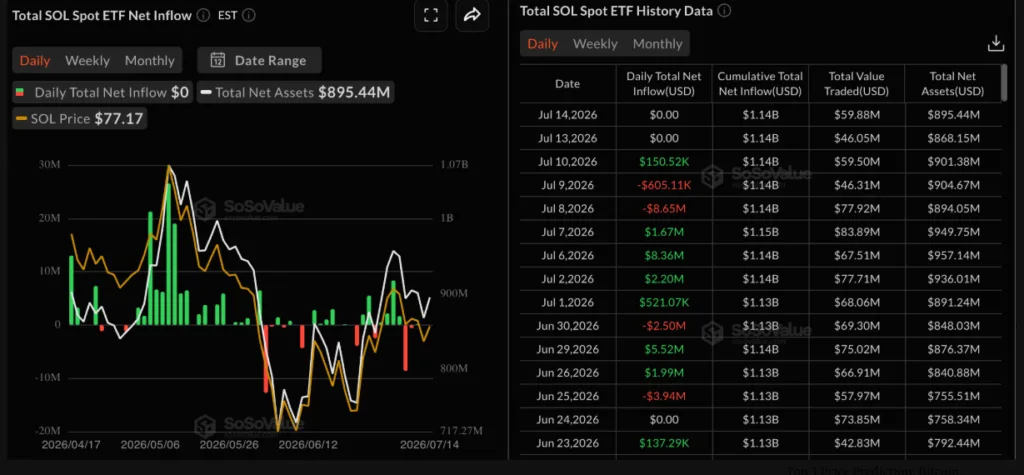
However, institutional demand remains limited. Solana exchange-traded funds (ETFs) recorded no inflows for two consecutive days this week, suggesting that larger investors are taking a cautious approach.

SOL Price Forecast: $81.50 Resistance Remains Crucial
Solana is currently trading near the $80 level as bulls attempt to extend the recovery. The price remains above the 50-day EMA at $76.82, which is acting as short-term support.
Despite the recent gains, SOL faces strong resistance near the descending trendline at $81.50. A breakout above this level could confirm a shift toward a more positive trend and open the path toward higher targets.
If SOL successfully moves above $81.50, the next major target sits around the 78.6% Fibonacci retracement level at $88.56. A continued rally could then push the price toward the 200-day EMA at $94.52.

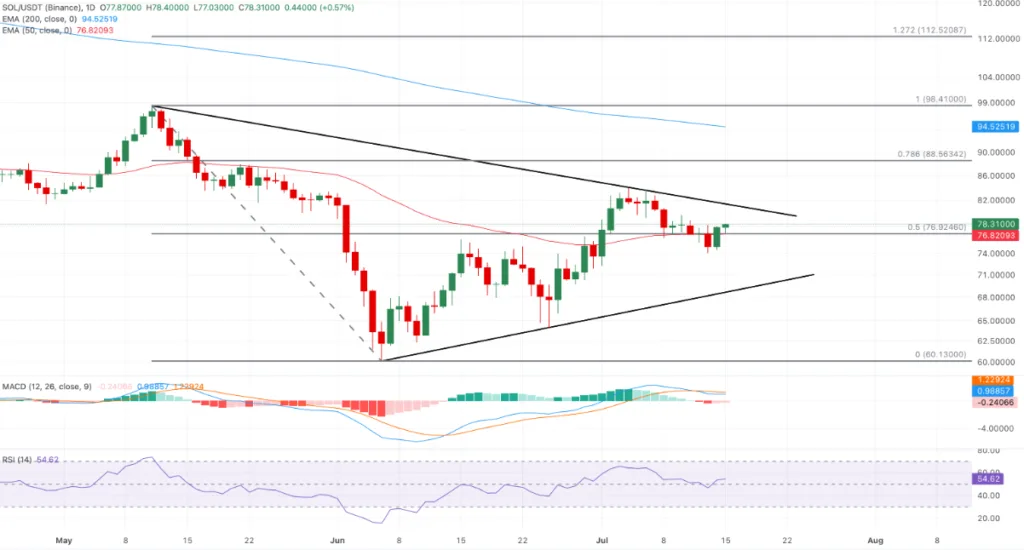
Technical indicators show a mixed but improving outlook. The Relative Strength Index (RSI) is around 54, pointing to mild buying pressure. Meanwhile, the Moving Average Convergence Divergence (MACD) indicator is approaching its signal line, reflecting a neutral market setup.
Key Support Levels to Watch
If Solana fails to break above the $81.50 resistance zone, sellers could regain control. The first important support level sits at the 50-day EMA near $76.82.
A deeper correction could send SOL toward the previous upward trendline around $68.88. If selling pressure increases further, the cycle low near $60.13 could become the next major support area.
For now, Solana’s recovery depends on whether retail demand can continue supporting the price and whether buyers can push SOL above the critical $81.50 resistance level. A successful breakout could strengthen expectations for a move toward $90 and beyond.
ALSO READ: SBI and Solana Partner to Build Japan’s On-Chain Financial Infrastructure
DISCLAIMER:
The views and opinions expressed herein are solely those of the author and do not necessarily reflect the views of the publisher. The publisher does not endorse or guarantee the accuracy of any information presented in this article. Readers are encouraged to conduct further research and consult additional sources before making any decisions based on the content provided.