Skip to content
Crypto News Focus logo CNF_CRYPTO_NEWS_FOCUS_LOGO 8

Crypto News Focus

your day to day crypto news site

Primary Menu
  • Home
  • News
    • Bitcoin News
    • Ripple XRP news
    • Ethereum News
    • Cardano News
    • Shiba Inu News
    • Pi Network News
    • More
  • Analysis
  • PR Desk
  • About Us
  • Policy & Privacy
  • Guides
    • Bitcoin Guides
    • Pi Network Guide
    • Cardano Guide
  • More
    • Politics
    • Tech
Light/Dark Button
  • Home
  • News
  • Solana Breaks Downtrend as Price Reclaims Key Support Level
  • Analysis
  • News

Solana Breaks Downtrend as Price Reclaims Key Support Level

Sean Williams 1 year ago (Last updated: 1 year ago) 3 minutes read 0 comments
Solana price analysis image
  • Solana’s price surged from $128.34 to $145 after a ceasefire between Israel and Iran eased market tensions, helping the altcoin reclaim key support.
  • With bullish technical indicators and rising buying pressure, SOL could rally up to $195.33 if it breaks above resistance levels.

After a week-long downtrend triggered by escalating tensions between Israel and Iran, Pi Network‘s bullish cousin, Solana (SOL), is making headlines with a significant price recovery. The altcoin recently bounced from a low of $128.34 to $145 following the announcement of a ceasefire agreement, setting the stage for a potential 35% rally.

Solana Reclaims Support with Geopolitical Boost

Solana’s downtrend began on June 16, pulling it down from $157.84 to a sharp low of $128.34. However, the ceasefire between Israel and Iran, confirmed by U.S. President Donald Trump on June 23, restored market confidence. This helped SOL reclaim its realized price of $132.35—a critical support level indicating average holder cost—which had briefly flipped to resistance.

With tensions easing, traders regained appetite for risk assets, and Solana was among the primary beneficiaries. The recovery has broken SOL out of its descending channel, a classic technical sign of trend reversal.

Technical Indicators Turn Bullish

Supporting this renewed optimism is the Moving Average Convergence Divergence (MACD) indicator, which has flashed a bullish crossover. The 12-period EMA has moved above the 26-period EMA, suggesting buyer strength is growing.
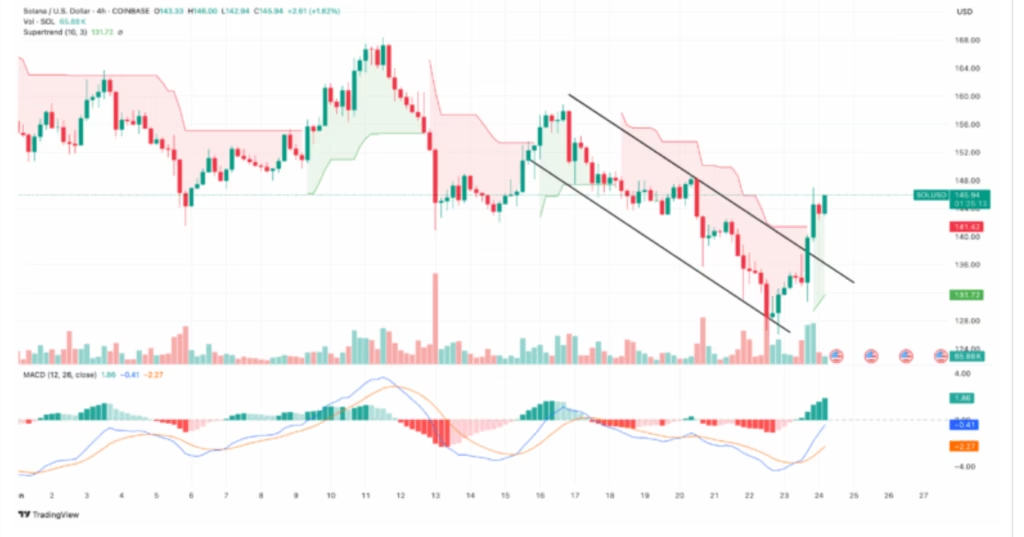
SOLANA / US DOLLAR PRICE CHART FOR 24 HOURS PERIOD
SOL/USD Daily Chart | Credit: TradingView

In addition, the Relative Strength Index (RSI) is rising steadily, indicating increasing buying pressure. This is complemented by the Supertrend indicator, which has flipped to a bullish setup with the green line now positioned under the current price—a sign that upward momentum could continue.

Solana Eyes 35% Upside—But Watch Key Levels

If Solana can break and hold above the 20-period EMA, analysts suggest it could first test resistance at $171.76. A clear move beyond this could propel it toward $195.33, marking a potential 35% rise from current levels.

However, failure to breach the 20 EMA may reintroduce bearish pressure. In that case, SOL could fall back below the lower boundary of its previous descending channel, risking a pullback toward $125.

DISCLAIMER:
The views and opinions expressed herein are solely those of the author  and do not necessarily reflect the views of the publisher. The publisher does not endorse or guarantee the accuracy of any information presented in this article. Readers are encouraged to conduct further research and consult additional sources before making any decisions based on the content provided.

About the Author

Sean Williams

Author

Visit Website View All Posts

Post navigation

Previous: Pi Network Price Falls to $0.50: Is a Deeper Slide Ahead?
Next: Stellar Targets $0.6659 After Rebound from Key Support Zone

Related Stories

ONDO FINANCE IMAGE
  • News

Ondo Finance Expands Intelligent Portfolios to Seven With AI and Magnificent 7 Products

vivian 1 day ago 0
Bitcoin ETF illustration showing a Bitcoin coin and upward stock chart on a black background
  • News

Bitcoin ETF Inflows Hit $2.65 Billion in September as Institutional Demand Holds

Sean Williams 1 day ago 0
XRP, CARDANO AND SOLANA IMAGE
  • Analysis

XRP, Cardano and Solana Price Forecast: Key Breakout Levels as Bullish Trend Returns

Cal Evans 1 day ago 0
Advertisement

For general inquiries, please email us at Info@cryptonewsfocus.com

Crypto news focus is your day-to-day crypto news site. Get all the latest News and trends in the crypto, blockchain, and DeFi space. For more info Visit About Us page

You May Have Missed

ONDO FINANCE IMAGE
  • News

Ondo Finance Expands Intelligent Portfolios to Seven With AI and Magnificent 7 Products

vivian 1 day ago 0
Bitcoin ETF illustration showing a Bitcoin coin and upward stock chart on a black background
  • News

Bitcoin ETF Inflows Hit $2.65 Billion in September as Institutional Demand Holds

Sean Williams 1 day ago 0
XRP, CARDANO AND SOLANA IMAGE
  • Analysis

XRP, Cardano and Solana Price Forecast: Key Breakout Levels as Bullish Trend Returns

Cal Evans 1 day ago 0
NEAR Protocol IMAGE
  • Analysis

Bitwise Launches First Spot NEAR ETF as NEAR Price Rebounds From $4.50

vivian 2 days ago 0
Join our Community
  • Facebook
  • X
  • YouTube
  • LinkedIn
Our Partners  MEXC
Disclaimer

Crypto News Focus provides Crypto and Blockchain news, analysis, and informational content for educational purposes only. Nothing on this website constitutes financial, investment, or legal advice.

Cryptocurrency markets are volatile. Always conduct your own research and consult a qualified professional before making any financial decisions.

Copyright © 2026 All rights reserved. | Crypto News Focus
Go to mobile version
We use cookies to ensure that we give you the best experience on our website. If you continue to use this site we will assume that you are happy with it.