


- Solana remains under pressure below $75 as ETF inflows slow and bearish positions increase in the derivatives market.
- Technical indicators show weakening buying interest, raising the risk of further downside if key support levels fail.
Solana (SOL) remains under pressure after failing to reclaim the $75 level, with both institutional and retail demand showing signs of weakness. The coin is trading near $72, and recent market data suggests sellers are maintaining control as bullish sentiment fades.
Solana Struggles to Attract Strong Buying Interest
SOL has been unable to build on last week’s recovery, risking a third straight day of losses. The recent rebound was capped below the 200-period EMA on the four-hour chart, a level that continues to act as strong resistance.
Institutional demand has also weakened. SOL-focused exchange-traded funds (ETFs) recorded zero net inflows at the start of the week after attracting more than $7 million in inflows during the previous week. The slowdown suggests large investors remain cautious despite recent price stabilization.

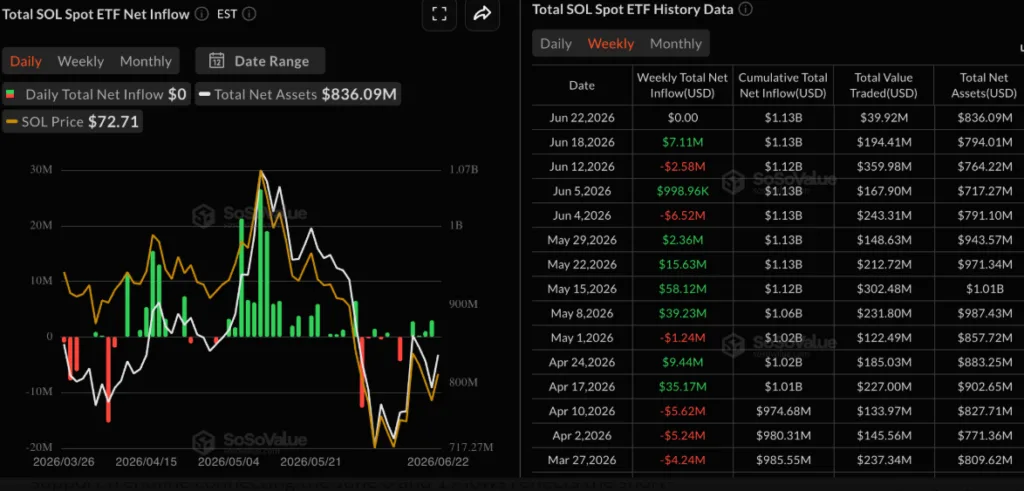
The lack of fresh institutional buying comes as the broader cryptocurrency market struggles to find a strong bullish catalyst. Ongoing macroeconomic uncertainty has also limited investor appetite for risk assets.
Derivatives Data Signals Growing Bearish Sentiment
Retail traders appear to be positioning for further downside. Solana futures open interest has climbed to approximately $5.34 billion, indicating increased market participation. Trading volume also rose by around 5% to $8.53 billion over the past day.
However, rising activity has not translated into stronger bullish sentiment. Funding rates have slipped below zero, suggesting a growing preference for short positions. Negative funding rates often indicate that traders are willing to pay a premium to maintain bearish bets, highlighting expectations of additional price weakness.

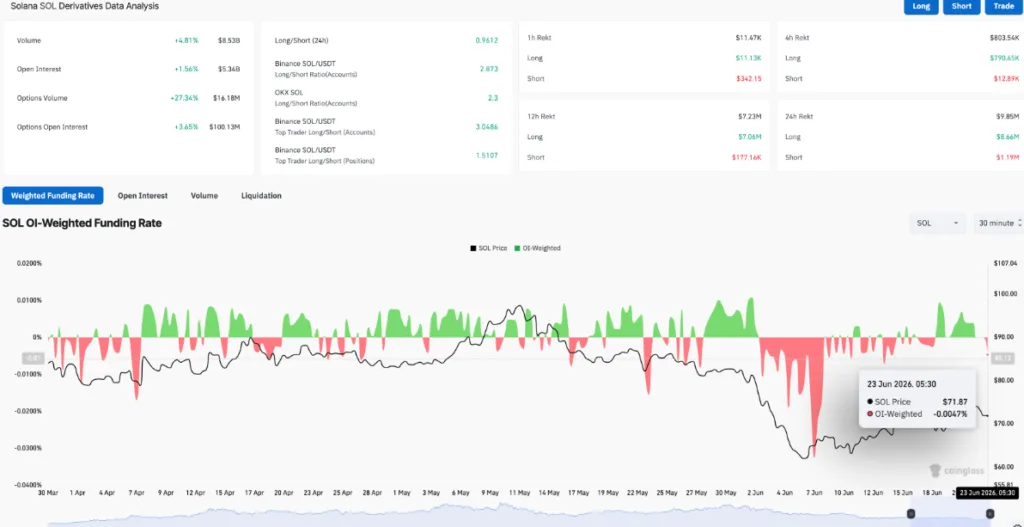
The combination of rising open interest, increasing volume, and negative funding rates points to a bearish buildup in the derivatives market.
Key Levels to Watch for Solana Price
From a technical perspective, Solana continues to hold above its 50-period EMA near $71.6, which currently serves as immediate support. A rising trendline connecting recent lows also provides additional short-term support.

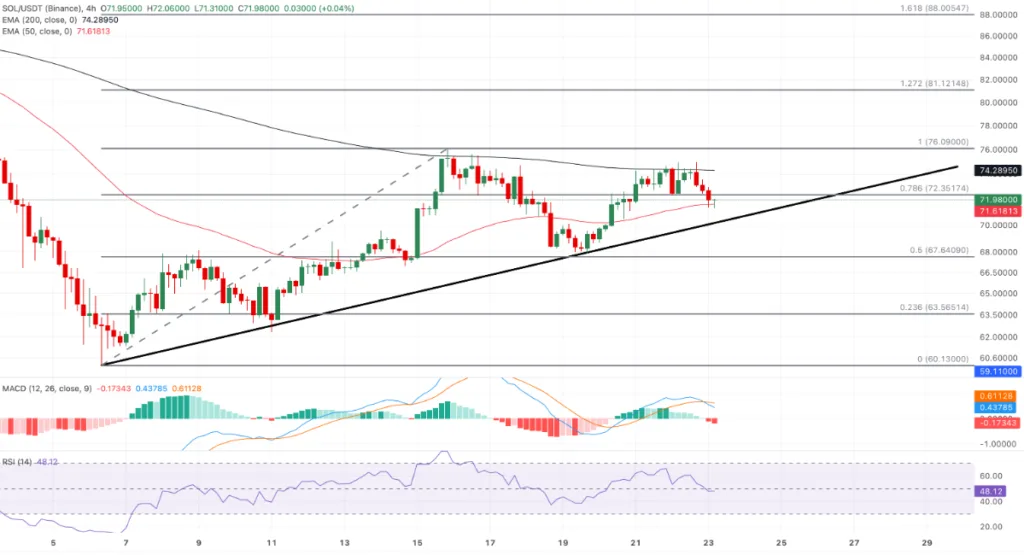
For bulls to regain control, SOL must break above the 200-period EMA around $74.3 and surpass the June 15 high near $76.1. A successful breakout above these levels could open the door toward the next upside targets around $81 and $88.
On the downside, failure to hold current support levels could expose SOL to a deeper correction. The 50% Fibonacci retracement level near $67.6 remains an important support zone if selling pressure intensifies.
Technical Indicators Show Fading Strength
Momentum indicators suggest that buying pressure is weakening. The RSI has moved closer to its neutral midpoint, reflecting reduced bullish strength.
Meanwhile, the MACD indicator has slipped slightly below its signal line. While this does not confirm a major bearish reversal, it indicates that upside pressure is fading and buyers are losing control in the short term.
Solana remains trapped below a critical resistance zone as institutional demand cools and derivatives traders increasingly favor bearish positions. Unless buyers can push the price above $75 and reclaim key technical levels, SOL could remain vulnerable to additional downside pressure in the coming sessions.
ALSO READ: Pi Network Issues Urgent Warning as Mainnet Migration Deadline Passes
DISCLAIMER:
The views and opinions expressed herein are solely those of the author and do not necessarily reflect the views of the publisher. The publisher does not endorse or guarantee the accuracy of any information presented in this article. Readers are encouraged to conduct further research and consult additional sources before making any decisions based on the content provided.