


- Solana enters April 2026 under bearish pressure, with a confirmed head-and-shoulders breakdown targeting $73.
- Weak exchange demand and cautious short-term holders suggest SOL’s path of least resistance remains downward unless recovery above $86 occurs.
Solana (SOL) enters April 2026 under significant pressure, extending a six-month losing streak that began in October 2025. With a confirmed head-and-shoulders breakdown and mixed on-chain signals, SOL faces key levels that could determine its near-term direction.
A Bearish Trend Persists Into April
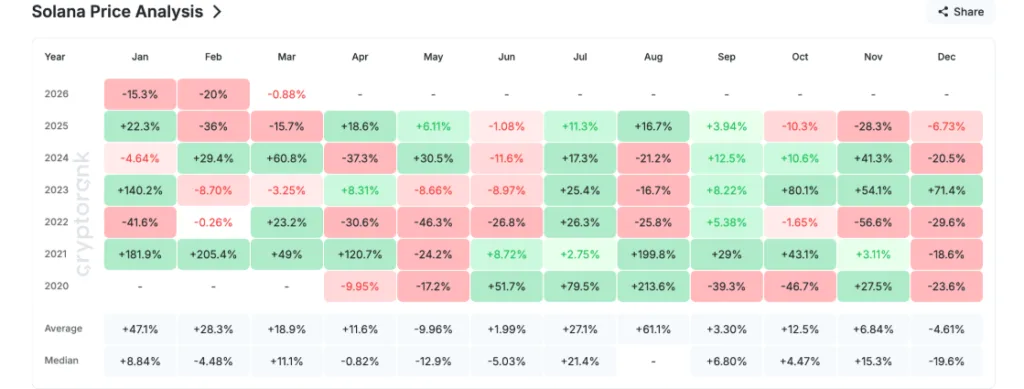
SOL has not posted a single green month since September 2025. January closed at -15.3%, February dropped 20%, and March is on track to finish slightly down at -0.88%. This six-month decline defies historical trends, as March typically has a median return of +11.1%.
April does not offer much hope either. Historically, Solana posts a median return of -0.82% in April, making it one of the weakest months on record. Counting solely on seasonal patterns could be risky for traders.

Head-and-Shoulders Breakdown Targets $73
The daily chart confirmed a head-and-shoulders breakdown on March 27, projecting a measured move near $73, which represents a potential 15% drop.

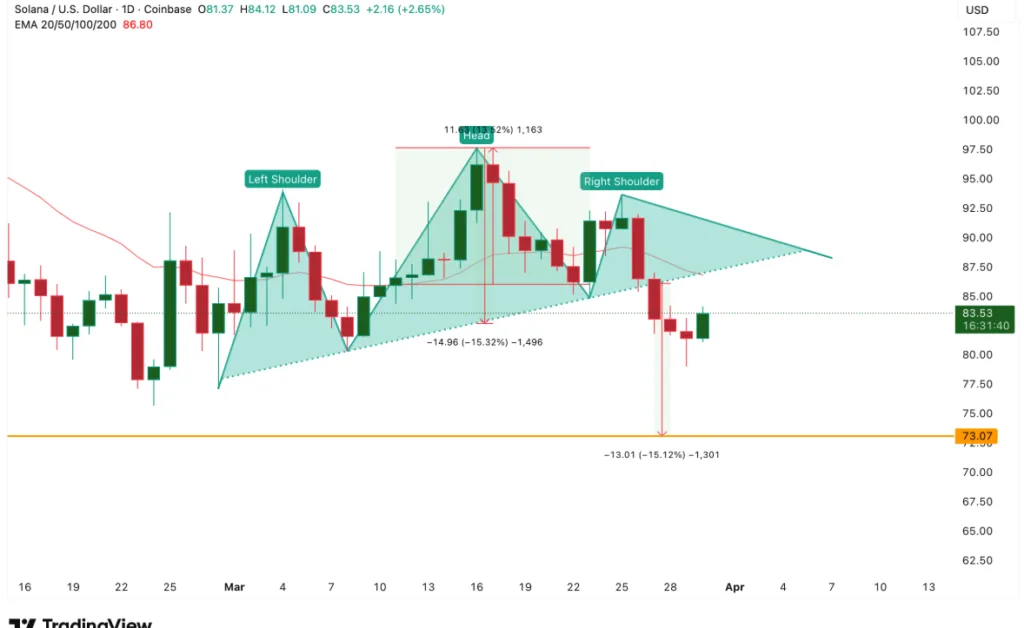
The 20-day Exponential Moving Average (EMA) sits at $86, and reclaiming this level could be SOL’s first sign of recovery. Failure to do so may push the price closer to the $73 target, aligning with the 1.618 Fibonacci retracement zone.
On-Chain Metrics Signal Weak Demand
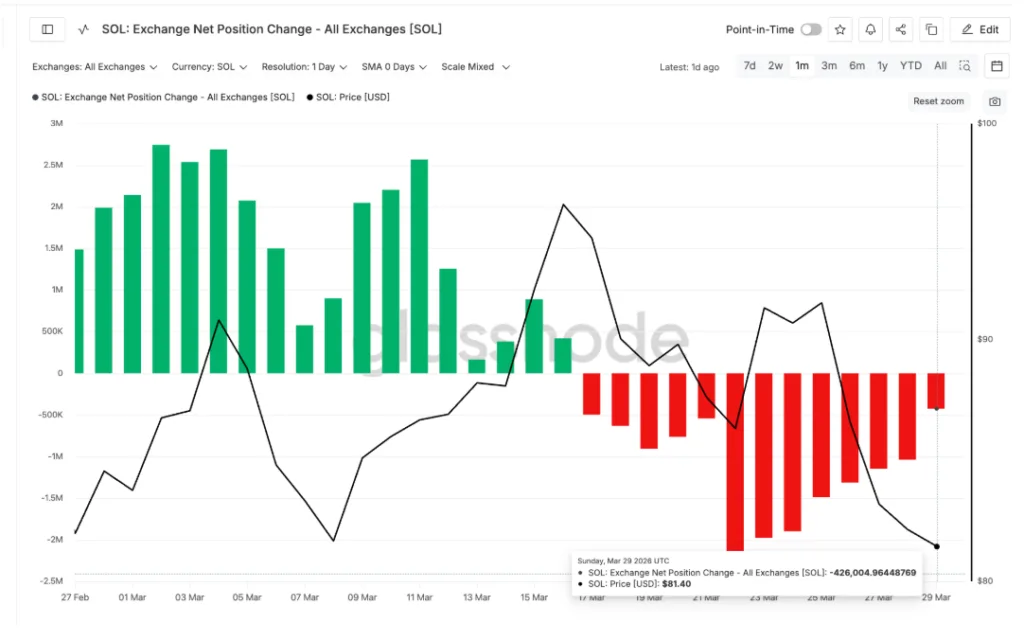
Buying pressure that supported SOL in mid-March has faded sharply. Exchange net position change shows that inflows to exchanges rose to roughly -426,004 SOL by March 29, an 80% decline from earlier in the month.

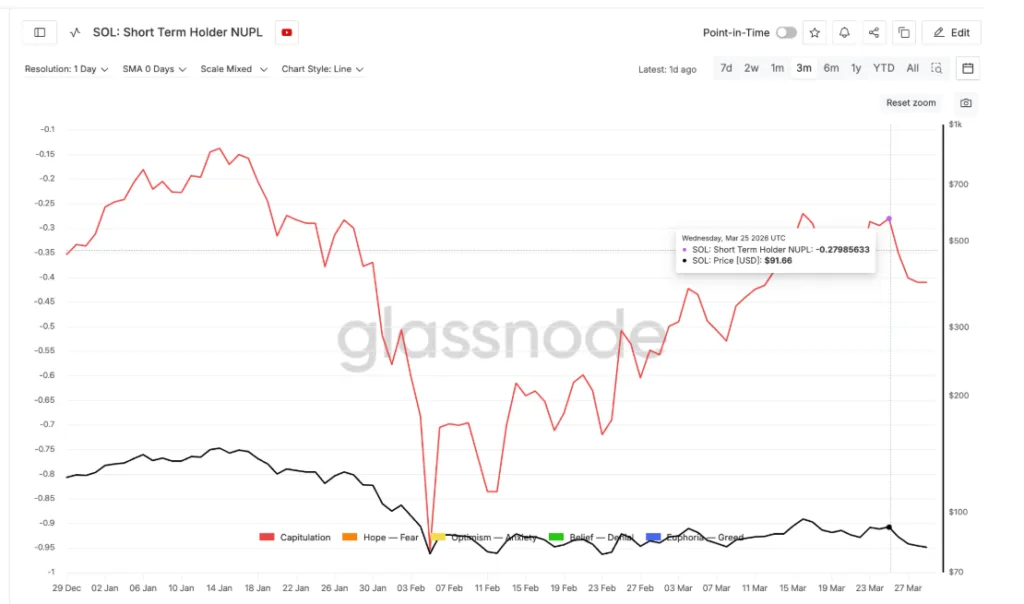
Short-term holders (STH) carry fewer losses, with NUPL rising from -0.95 in early February to -0.40 by late March. Without renewed demand, these holders may sell, accelerating SOL’s decline toward $73.

Hodlers Offer Some Resistance
Long-term holder accumulation has surged from 523,624 SOL on March 8 to 2,327,302 SOL by March 29. While this demonstrates strong conviction, historical trends show that past hodler accumulation did not trigger immediate price recoveries.

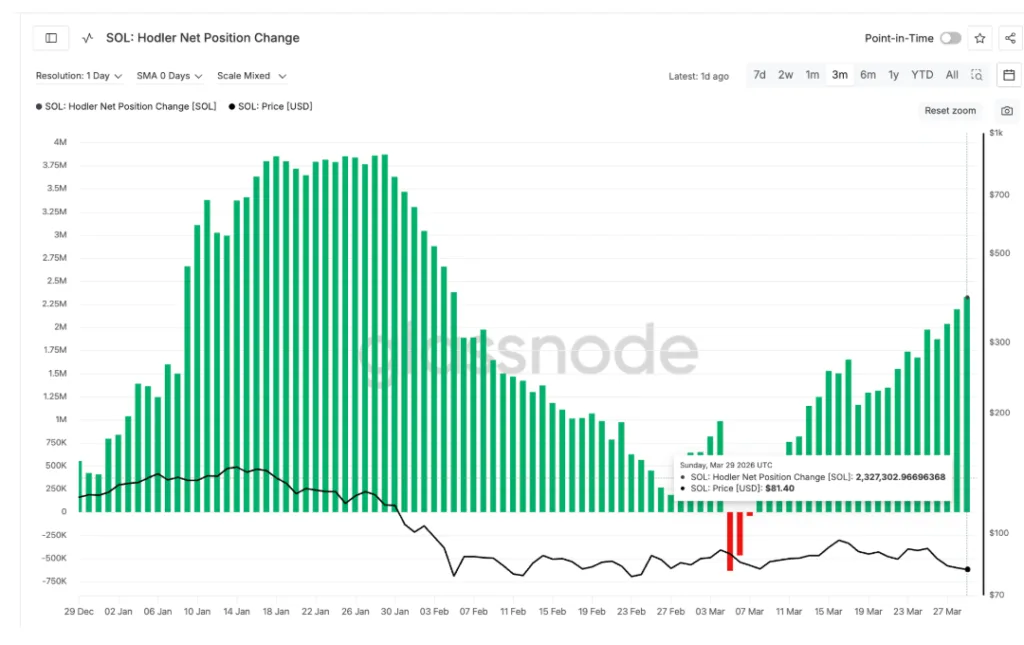
If exchange outflows resume and spot demand returns, hodlers could help stabilize the price. Otherwise, their buying alone may not prevent the measured move from playing out.
Key Price Levels for April
Looking at the chart, Solana has some important levels to watch this month.
Support: The first level is $80. If SOL closes below this, it could move down to the $73 target from the head-and-shoulders pattern. This level also lines up with the 1.618 Fibonacci retracement, which adds extra weight to it.
Resistance: On the upside, $85 is the first resistance, then the 20-day EMA at $86. If SOL can move above the EMA, it might test the $93 right shoulder high. Breaking past $93 would weaken the bearish setup.

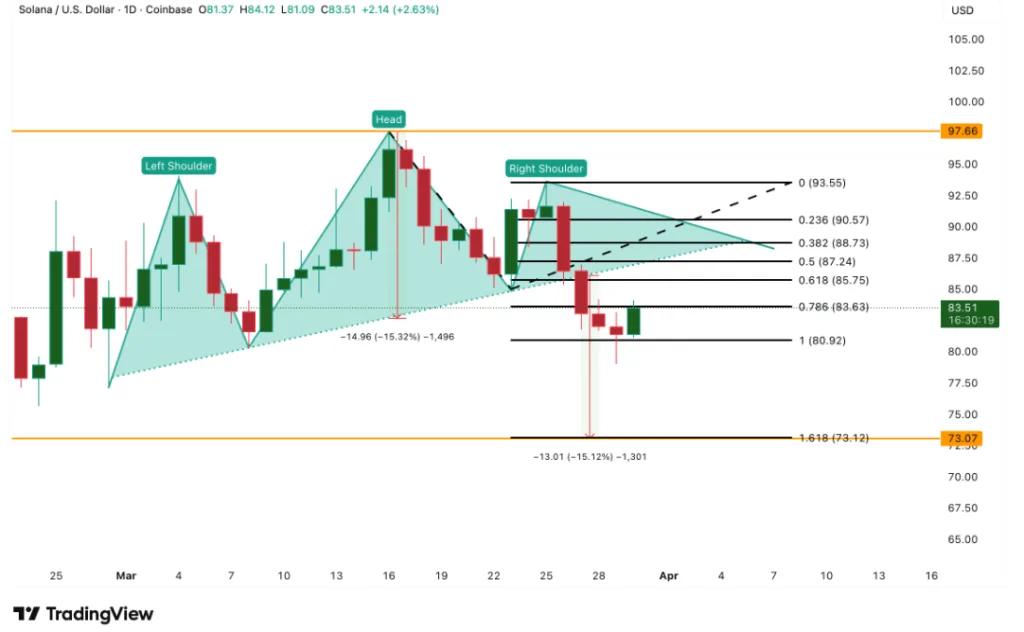
The short-term outlook hinges on whether SOL can hold above $80 and reclaim the 20-day EMA at $86. Failure to do so points to continued weakness and a potential drop to $73.
ALSO READ: Solana Price Prediction as SOL Risks Drop to $82 at Key Support
DISCLAIMER:
The views and opinions expressed herein are solely those of the author and do not necessarily reflect the views of the publisher. The publisher does not endorse or guarantee the accuracy of any information presented in this article. Readers are encouraged to conduct further research and consult additional sources before making any decisions based on the content provided.