


- Solana is holding near $118 after a 22% two-week gain, supported by strong ETF inflows and rising network activity.
- Stablecoin supply reached $17.3 billion, while Solana’s RWA ecosystem surpassed $4.6 billion.
Solana (SOL) is trading below $119 on Monday after climbing more than 22% over the past two weeks. The latest pullback comes as demand for Solana through spot ETFs remains strong, with weekly inflows reaching $188.22 million.
The network is also posting record figures in areas beyond price action. Stablecoin supply has reached $17.3 billion, while the value of real-world assets on Solana has risen above $4.6 billion.
Solana Spot ETFs See Strong Inflows
US-listed spot Solana ETFs attracted $188.22 million in net inflows last week, according to data from SoSoValue, marking another strong week of institutional demand for SOL.

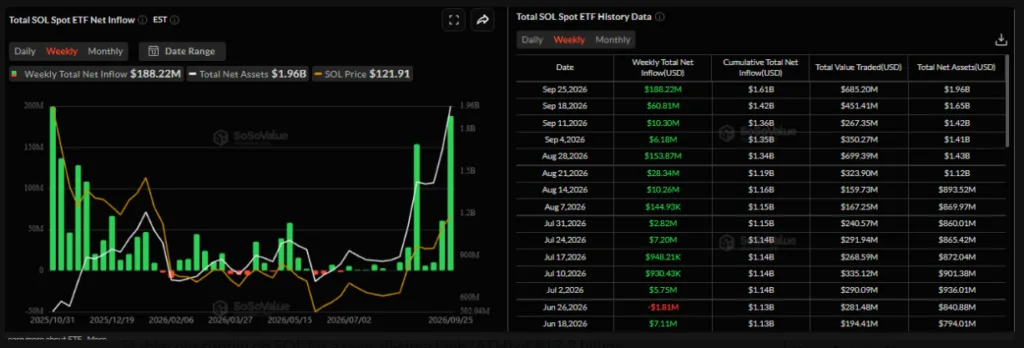
It was the second-highest weekly inflow since the ETFs launched. The latest figure also marked the 13th consecutive week of positive flows since early June.
The continued inflows point to sustained demand from investors through regulated investment products. If the trend continues, it could provide further support for SOL as the market enters a new week.
Solana Stablecoin Supply Hits $17.3 Billion
Solana’s on-chain activity continues to strengthen, with stablecoin supply on the network climbing to a new all-time high of $17.3 billion and highlighting the growing amount of liquidity within its ecosystem.
Stablecoin supply on the network reached a new all-time high of $17.3 billion. The increase highlights the growing amount of stablecoin liquidity available across the Solana ecosystem.
The network’s real-world asset sector also reached a record level. RWA value on Solana climbed above $4.6 billion across more than 3,000 assets.
Meanwhile, the number of tokenized equity holders on Solana has surpassed 1 million, marking another significant milestone for the network’s growing real-world asset ecosystem.
These figures show that activity is expanding beyond trading and speculative demand. Stablecoins and tokenized real-world assets are becoming a larger part of Solana’s ecosystem.
SOL Price Tests Resistance Near $124
SOL was trading around $118.36 at the time of writing. Despite the latest pullback, the token remains above several key moving averages on the daily chart.

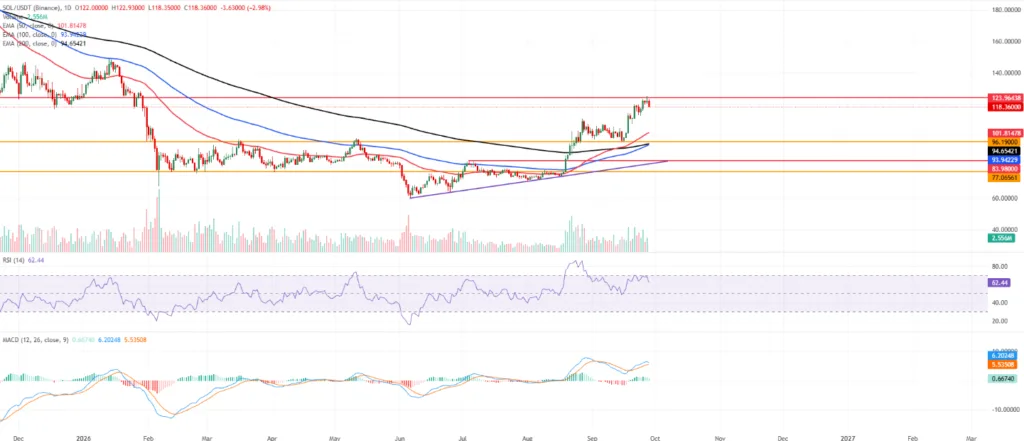
The 50-day EMA stands near $101.81. The 100-day and 200-day EMAs are around $93.94 and $94.65, respectively. The RSI is near 62. This indicates positive momentum without pushing the market into traditionally overbought territory.
The next major resistance level is around $123.96. A daily close above this level would put the recent high into focus and could signal another move higher.
On the downside, the 50-day EMA near $101.81 is the first major support area. Further support sits around $96.19, followed by the $93-$95 region where the longer-term moving averages are located.
Solana Outlook
Solana is entering the week with several supportive factors in place. Strong ETF inflows, record stablecoin supply and growth in the RWA ecosystem are keeping attention on the network.
For SOL, the $123.96 resistance level remains important in the near term. Holding above the key moving averages would also help preserve the current upward structure, while a move below major support levels could change the short-term picture.
DISCLAIMER:
This article reflects the author’s views and is provided for informational purposes only. While we strive for accuracy, the publisher does not guarantee that all information is complete or current. Readers should verify important information and consult appropriate sources before making decisions based on this content.