


- Solana holds above key support as rising institutional inflows and growing market interest strengthen its outlook.
- Bullish technical signals and trader positioning suggest potential upside if resistance levels are broken.
Solana (SOL) is showing renewed strength, with price action holding steady above a recently broken consolidation zone. Trading near $94–$95, the coin appears to be building a foundation for a potential upside move as institutional interest and market indicators align in favor of buyers.
Institutional Inflows Strengthen Solana’s Outlook
A major driver behind Solana’s recent stability is rising institutional demand. Spot SOL Exchange Traded Funds (ETFs) listed in the US recorded an inflow of $17.81 million on Tuesday, following a $2.82 million inflow the previous day. This marks five consecutive days of positive flows since March 10, signaling growing confidence among large investors.

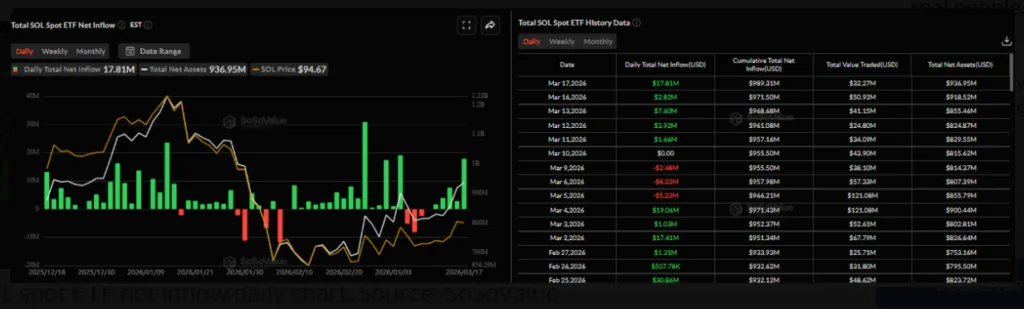
Sustained inflows often act as a catalyst for price growth, as they reflect long-term positioning rather than short-term speculation. If this trend continues, SOL could benefit from increased liquidity and stronger buying pressure in the near term.
On-Chain and Derivatives Data Support Bullish Case
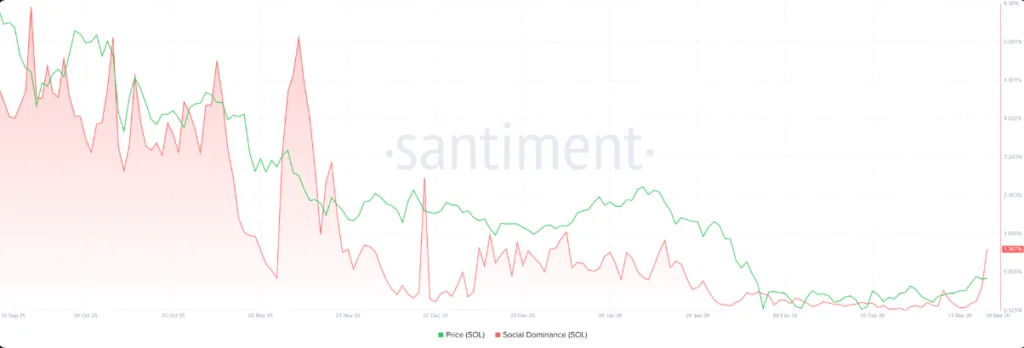
Beyond institutional activity, market sentiment is also improving across key metrics. Data from Santiment shows that Solana’s social dominance has been rising steadily, reaching its highest level since January. This indicates increased discussion and attention across the crypto space, often a sign of growing investor interest.

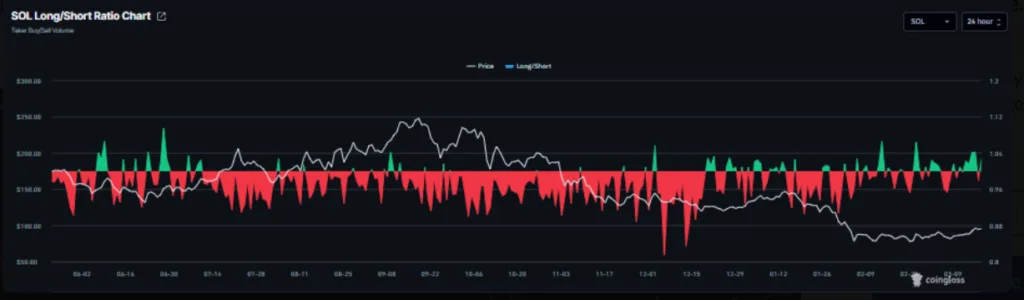
Meanwhile, derivatives data from CoinGlass reveals a long-to-short ratio above 1.0. This suggests that more traders are betting on price increases rather than declines, reinforcing a cautiously bullish outlook.

Technical Structure Signals Potential Breakout
From a technical perspective, Solana has recently broken above key resistance levels, including a descending trendline and the upper boundary of a parallel channel. This breakout shifts the short-term structure away from a downtrend and supports the case for further gains.

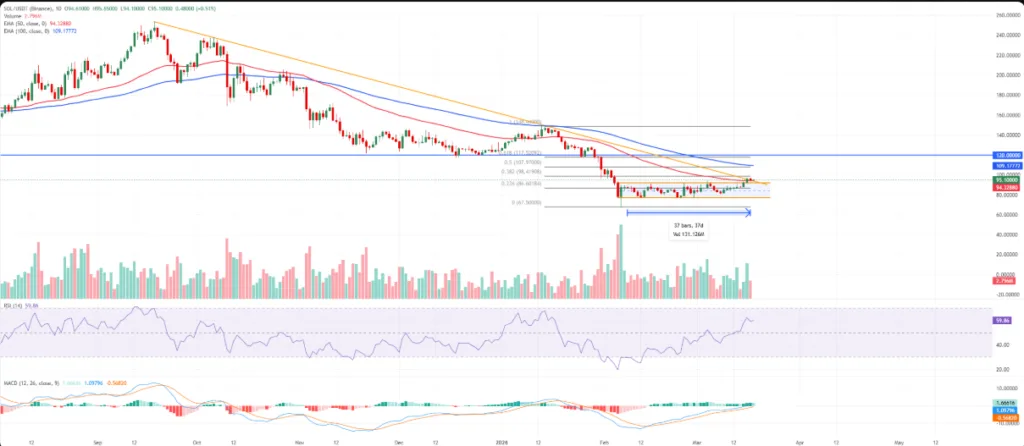
Momentum indicators also reflect strengthening conditions. The Relative Strength Index (RSI) remains near 60, while the Moving Average Convergence Divergence (MACD) continues to trend in positive territory. These signals suggest that buying strength is gradually increasing.
Immediate support levels are now positioned around $92.10, followed by $86.60 and $77.10. As long as the price remains above these zones, the bullish setup stays intact.
On the upside, resistance is seen near $98.42. A break above this level could open the door toward $107.97 and potentially the $120 region, where stronger resistance may emerge.
Outlook for Solana
Overall, Solana’s price action reflects a market that is stabilizing after prior weakness. With institutional inflows rising and key indicators turning positive, the outlook leans toward gradual upside movement. However, confirmation will depend on whether buyers can maintain control above current support levels and push through nearby resistance zones.
ALSO READ: What Could Trigger the Next Bitcoin Rally in 2026
DISCLAIMER:
The views and opinions expressed herein are solely those of the author and do not necessarily reflect the views of the publisher. The publisher does not endorse or guarantee the accuracy of any information presented in this article. Readers are encouraged to conduct further research and consult additional sources before making any decisions based on the content provided.