


- Solana is trading near $81 under bearish pressure, with sellers targeting the key $79 support level.
- Despite short-term weakness, steady institutional ETF inflows suggest potential for recovery if resistance at $89.21 is broken.
Solana is trading under pressure as sellers continue to dominate short-term price action. The coin is hovering around $81.82, down about 1.46% on the day. It also remains below key moving averages, signaling weak near-term strength. Traders are now watching the $79 support zone closely for direction.
Solana trades under pressure below key levels
Solana is struggling to stay above important technical indicators. The price remains below the SMA-20, SMA-50, and SMA-200 levels. These stand at $85.89, $86.39, and $104.48, respectively.
Intraday movement is also tight, with price action locked in a narrow range. Sellers continue to control short-term direction. Indicators such as MACD and ADX confirm weak buying strength and persistent downside pressure.
Institutional inflows support long-term outlook
Despite short-term weakness, institutional demand is still present. Over $115 million flowed into Solana-focused ETFs in May. This marks four consecutive weeks of net inflows.
Spot ETF buying has also added about $113 million in new capital. At the same time, futures open interest dropped by around 30%. This shows reduced speculative activity and a shift toward direct holding rather than leveraged trading.
Key technical levels define the next move
Solana faces strong resistance near $85 to $89.21. The Ichimoku Kijun level at $89.21 is the main upside barrier. On the downside, $79 is the key support level. A breakdown below this zone could trigger stronger selling pressure. If that happens, the price may extend losses in the short term.
For bulls to regain control, Solana must close above $89.21. Without that move, the market remains range-bound with a bearish bias.
Downside risk grows if $79 support breaks
Short-term forecasts suggest Solana may trade between $79 and $85.50 over the next few days. Sellers currently maintain control of price action. A drop below $79 would likely accelerate declines. However, holding this level could stabilize the market and support consolidation.

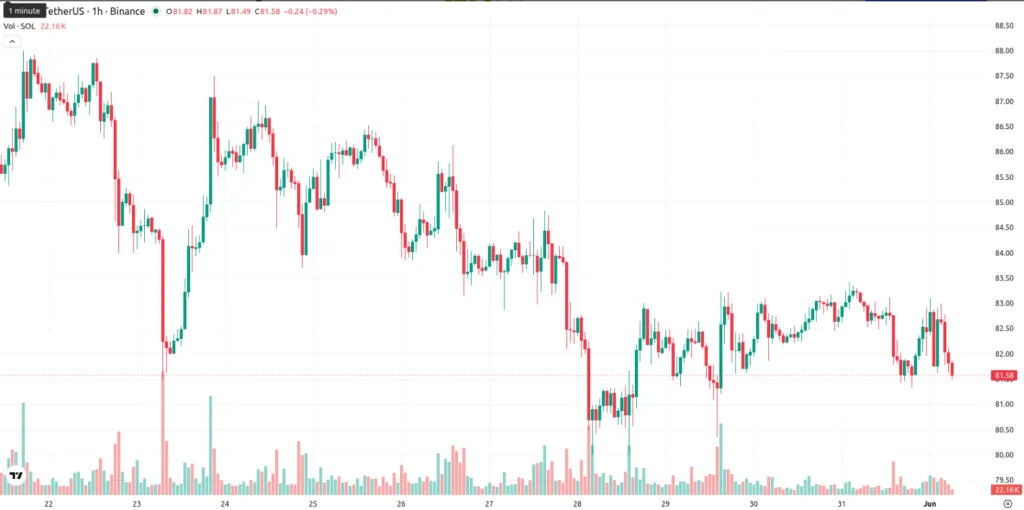
Volatility remains low, which suggests traders are waiting for a clear breakout or breakdown before committing strongly.
Market outlook and analyst view
Analysts note that reduced leverage has improved market structure. However, selling pressure still limits upside potential in the near term. Experts suggest that accumulation may be more favorable while prices remain near support zones. Institutional inflows and improving network interest continue to support the longer-term outlook.
If Solana breaks above the resistance at $89.21, sentiment could shift more positively. Until then, the market remains cautious with a focus on key support at $79.
ALSO READ: Hyperliquid’s HYPE Hits Record High Above $73: Here’s What’s Driving the Surge
DISCLAIMER:
The views and opinions expressed herein are solely those of the author and do not necessarily reflect the views of the publisher. The publisher does not endorse or guarantee the accuracy of any information presented in this article. Readers are encouraged to conduct further research and consult additional sources before making any decisions based on the content provided.