


- Solana price is testing the key $70 support after a broader crypto market decline, with buyers defending the $65–$71 range.
- A break below support could trigger further losses, while improving technical indicators hint at a possible recovery.
Solana (SOL) is trading at a crucial support zone after falling alongside the broader cryptocurrency market. While the recent decline has raised concerns among investors, blockchain data suggests buyers are actively defending the $65 to $71 range.

Technical indicators are sending mixed signals. Some point to weakening price action, while others hint that selling pressure may be easing. The coming days could determine whether SOL stages a recovery or extends its decline.
Solana Price Defends a Critical Support Zone
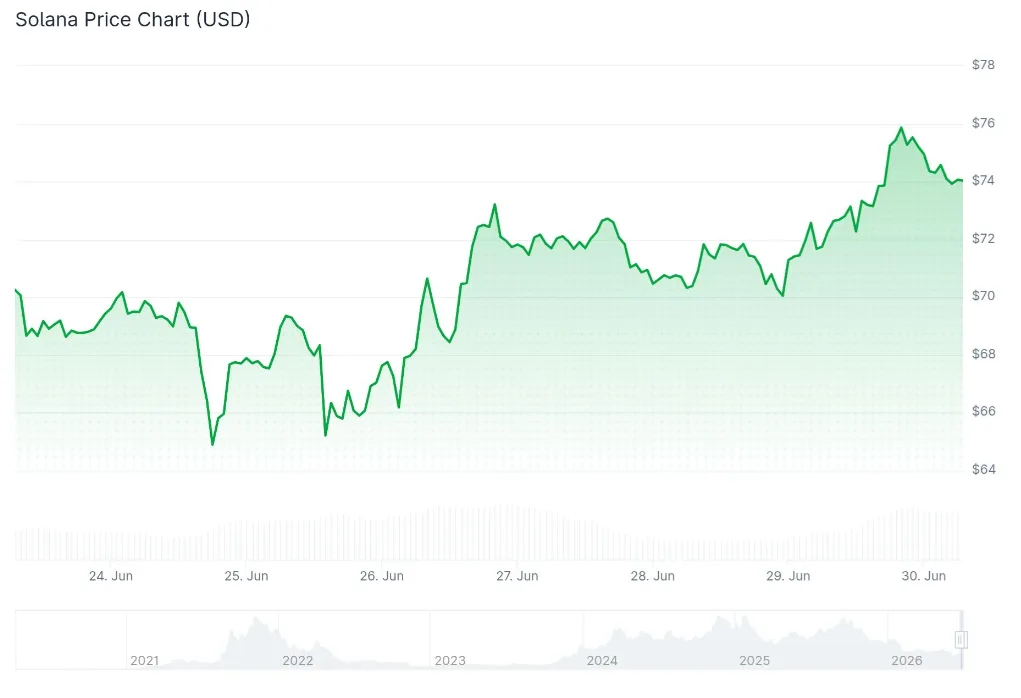
Solana dropped to around $71.37 after the wider crypto market came under pressure. Bitcoin’s decline also weighed on altcoins, pulling SOL closer to an important support area.
On-chain data shows that more than 60 million SOL tokens were traded between $65 and $71. This makes the zone one of the strongest support levels for the cryptocurrency. Investors who accumulated SOL within this range could help prevent further downside.
More than 60 million Solana $SOL changed hands between $65 and $71, making this one of the strongest support zones.
As long as this demand cluster holds, the bullish structure remains intact.
If it breaks, the next major support levels based on the UTXO Realized Price… pic.twitter.com/t4lAKe7v6E
— Ali Charts (@alicharts) June 28, 2026
If buyers continue defending the area, Solana could stabilize before attempting another move toward the $73 resistance level.
A Break Below $70 Could Trigger Further Losses
The technical outlook would weaken if SOL falls below the $70 mark. Analysts are closely watching the $64 support level. A break below that area could expose the coin to a deeper decline toward $53.10, where another notable concentration of trading activity exists.
Additional support levels remain at $23.60 and $8.85. However, the $53.10 zone is considered the most important if selling pressure increases in the near term.
The recent weakness has not been driven by Solana alone. Bitcoin also declined, while the overall cryptocurrency market lost value. This shows that SOL continues to move closely with broader market trends.
Technical Indicators Offer Mixed Signals
Technical indicators present two different scenarios for Solana. One view shows the daily RSI near oversold territory, while the MACD remains below the neutral line despite showing signs of improvement. This suggests bearish pressure has not completely disappeared.
Another analysis appears more encouraging. The RSI has recovered to 51.60, while the MACD has produced a bullish crossover. These signals suggest that selling pressure could be fading.
Even so, stronger trading volume and a move above key resistance levels are needed before confirming a sustained recovery.
World Xyz Launch Brings Fresh Attention to Solana
Beyond price action, the Solana ecosystem received positive news after the official launch of World Xyz.
Mysterious Solana Project World Xyz Revealed
A mysterious Solana ecosystem project, @world_xyz, has officially been revealed.
The project had reportedly acquired the domain world(.)xyz for $80,000.
Solana Foundation's @vibhu officially unveiled World as an x402-based… pic.twitter.com/OSBKWDXGXt
— BSCN (@BSCNews) June 29, 2026
The project, built on Solana, describes itself as an agent-focused settlement infrastructure using the x402 protocol. It also aims to provide decentralized infrastructure for tokenizing real-world assets.
The announcement generated fresh interest within the Solana community and helped support a modest price rebound following the launch.
Analysts Remain Divided on SOL’s Next Move
Market analysts continue to offer different outlooks for Solana. Some believe losing the $65 to $75 support range could send SOL toward the $50 to $55 area. Others note that the cryptocurrency is showing improved strength on lower time frames but still faces challenges on higher time frames.
Several analysts agree that reclaiming the $78 level would significantly improve the technical picture.
Meanwhile, Solana’s network activity remains strong. Trading volume reportedly climbed above $67 billion during the second quarter, driven by memecoin trading, staking activity, and decentralized applications.
However, ETF data showed net outflows of $5.8 million during June, while reports of a large short position have added uncertainty to the market outlook.
Solana has reached a decisive point. The $65 to $71 support zone remains the most important level to watch, with $70 acting as a key psychological barrier.
Holding above this area could allow SOL to stabilize and challenge higher resistance levels. Losing it, however, could open the door to another wave of selling, making the next few trading sessions especially important for investors
ALSO READ: Why Shiba Inu Price Could Fall Further After Hitting a Five-Year Low
DISCLAIMER:
The views and opinions expressed herein are solely those of the author and do not necessarily reflect the views of the publisher. The publisher does not endorse or guarantee the accuracy of any information presented in this article. Readers are encouraged to conduct further research and consult additional sources before making any decisions based on the content provided.