



- Solana tests $87 resistance near 50-day EMA after weekly gains.
- Bullish on-chain and derivatives data suggest a breakout if the level breaks.
Solana (SOL) is trading close to a key technical level at $87 after rising more than 3% this week.
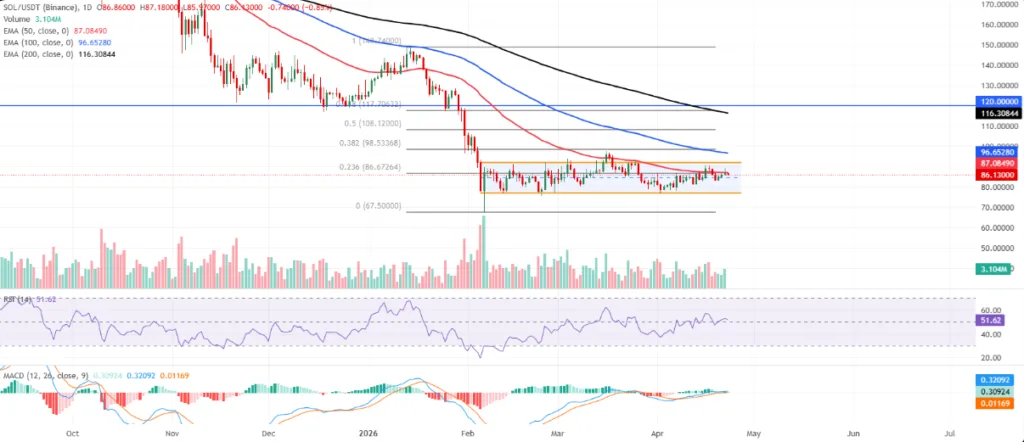
The price is now testing the 50-day Exponential Moving Average, a level that often acts as strong resistance or support.
At the time of writing, SOL is trading around $86.13 while still moving inside a sideways channel. Despite recent gains, the broader trend remains capped below major moving averages, keeping traders cautious.
A daily close above $87 could confirm renewed bullish strength and open the door for a stronger upward move.
On-Chain and Derivatives Data Strengthen Bullish Outlook
Market data is showing improving conditions behind Solana’s recent price action.
Whale activity and spot market signals
On-chain data indicates increased activity from large investors, commonly known as whales. These large orders suggest accumulation is taking place around current levels.

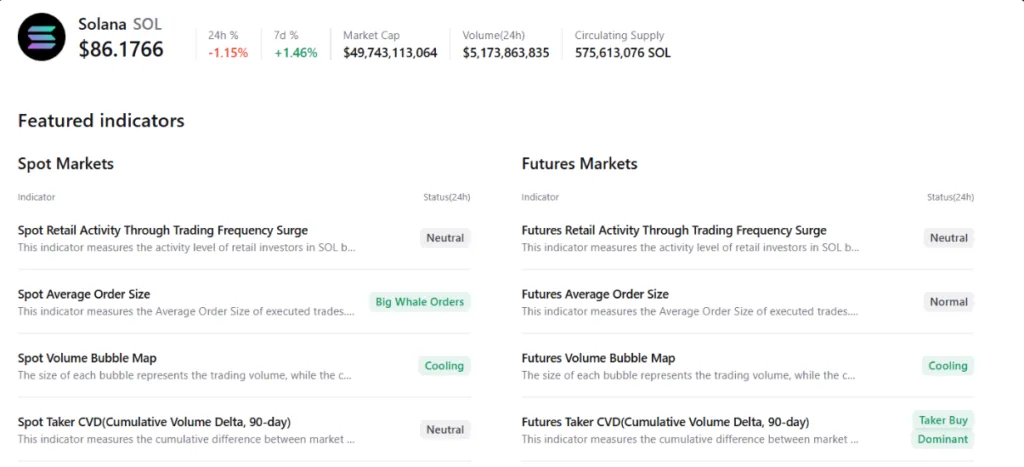
At the same time, spot market conditions are cooling, which often helps reduce volatility and supports stable upward moves.
Futures market support
Derivatives data is also leaning positive. Futures markets show buy-side dominance, meaning more traders are positioning for upside movement.
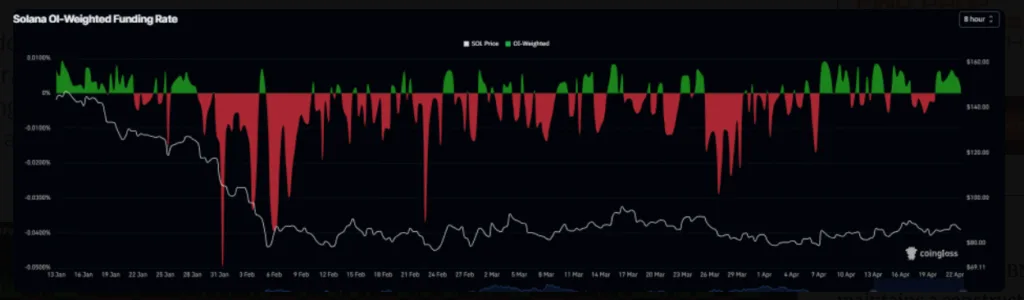
Funding rates have also turned positive and climbed to 0.0016%. This shows long traders are paying shorts, a setup that has historically supported bullish continuation when sustained.

Technical Outlook Shows Tight Resistance Zone at $87
Solana remains stuck below a cluster of resistance levels that are limiting upward momentum.
Immediate resistance is found at:
- $86.67 (23.6% Fibonacci retracement)
- $87.08 (50-day EMA)
A strong break above this zone could shift market control to buyers.
If SOL clears this range, the next upside targets include:
- $92.11 (channel resistance)
- $96.65 (100-day EMA)
- $98.53 (38.2% Fibonacci level)
Key Support Levels to Watch
On the downside, Solana has important support levels that could stabilize price action if selling pressure increases.
- $77.12: First major support at channel boundary
- $67.50: Deeper structural support zone
A break below $77.12 would weaken the current bullish setup and increase downside risk.

Solana Price Outlook
Solana is at a critical technical point where direction will likely be decided soon. On-chain strength, improving derivatives data, and rising momentum indicators all suggest bullish potential.
However, confirmation is still needed through a clean break above $87. Until then, SOL remains in a consolidation phase with pressure building on both sides.
ALSO READ: Ripple Transfers 75M XRP to Coinbase, Its Price Impact Explained
DISCLAIMER:
The views and opinions expressed herein are solely those of the author or advertiser and do not necessarily reflect the views of the publisher. The publisher does not endorse or guarantee the accuracy of any information presented in this article. Readers are encouraged to conduct further research and consult additional sources before making any decisions based on the content provided.