


- Solana trades near $122 under heavy selling pressure.
- Rallies remain weak, with resistance at $145–$150.
Solana (SOL) continues to face sustained selling pressure, trading near the $122 level amid a broader market downtrend. After peaking in late September, the cryptocurrency has failed to regain key moving averages, signaling that the corrective pullback has evolved into a more persistent decline.
MIGHT ALSO LIKE:Ondo Finance to Launch Tokenized U.S. Stocks and ETFs on Solana
Technical Downtrend Remains Firm
The daily chart confirms that Solana’s downtrend is firmly established. Initial weakness appeared when SOL slipped below the 20-day and 50-day EMAs in early November. More crucially, the failure to reclaim the 100-day EMA solidified a broader shift in trend structure. The 200-day EMA, currently near $169, is beginning to slope lower, highlighting deterioration in medium-term price dynamics.

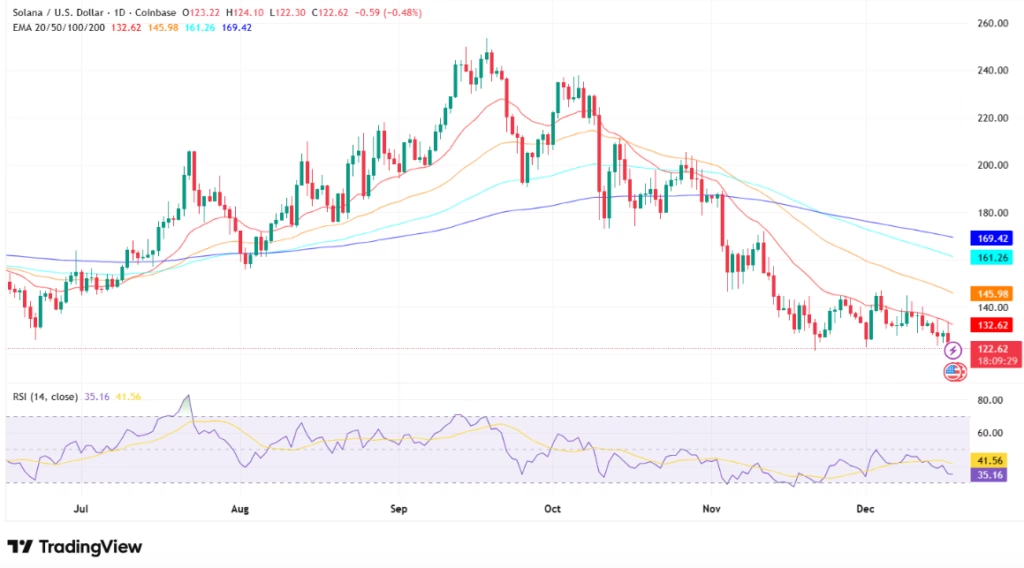
Rebounds have repeatedly stalled below the $145–$150 range, which now acts as strong resistance. Attempts to rally into this zone have been consistently rejected, showing that dip buyers are defensive rather than confident. Momentum indicators support this bearish view: the daily RSI remains in the mid-30s, typical of sustained downtrends, with no meaningful bullish divergence forming.
Short-Term Structure Remains Fragile
On lower timeframes, sellers continue to dominate. Both the Supertrend and Parabolic SAR remain aligned to the downside on the 30-minute chart, and intraday rallies have been shallow and short-lived. Recent rejections from the $133 area further confirm the pattern of lower highs that has defined SOL’s price action since October. Volatility remains elevated, reflecting the fragility of short-term price movements.
Leverage and Spot Flows Amplify Downside Risk
Derivatives data adds another layer of caution. Futures open interest has risen even as SOL trends lower, showing aggressive long positioning. Elevated long-to-short ratios have led to repeated long liquidations, particularly on 12-hour and 24-hour timeframes. These liquidations indicate that declines are amplified by leverage unwinds rather than purely discretionary selling.
Spot flow data also signals distribution. Netflows remain negative, with more SOL moving onto exchanges than off them. Larger participants appear cautious, with accumulation absent, reinforcing the downside bias.
Market Outlook
Critical near-term support now lies in the $120–$118 zone. A daily close below this range could expose the low-$110s. To shift the bearish structure, Solana would need to reclaim $132 and sustain levels above $145. Without these recoveries, the broader downtrend remains intact, and tactical bounces are unlikely to reverse the negative market environment.
Solana’s trend, momentum, leverage positioning, and outflows all point to continued vulnerability, keeping traders cautious as lower levels remain unfinished business.
DISCLAIMER:
The views and opinions expressed herein are solely those of the author or advertiser and do not necessarily reflect the views of the publisher. The publisher does not endorse or guarantee the accuracy of any information presented in this article. Readers are encouraged to conduct further research and consult additional sources before making any decisions based on the content provided.