


- Solana (SOL) faces a potential pullback as its price hovers around $206, with DeFi TVL down 15% from September highs.
- Negative funding rates and bearish technical indicators suggest a risk of further decline below the $200 level.
Solana (SOL) is showing signs of correction after a recent rally, trading around $206 at the time of writing. While the blockchain has enjoyed strong gains over the past weekend, indicators point to potential risks that could push the price below the critical $200 level.
DeFi TVL Shows Significant Decline
Solana’s decentralized finance (DeFi) ecosystem experienced a peak Total Value Locked (TVL) of $13.22 billion on September 14. However, heightened market volatility led to a sharp drop to $10.78 billion by Friday. As of Tuesday, the average TVL stands at $11.23 billion. Analysts warn that if the price falls below $200, stakers could withdraw funds, fueling a potential sell-off.

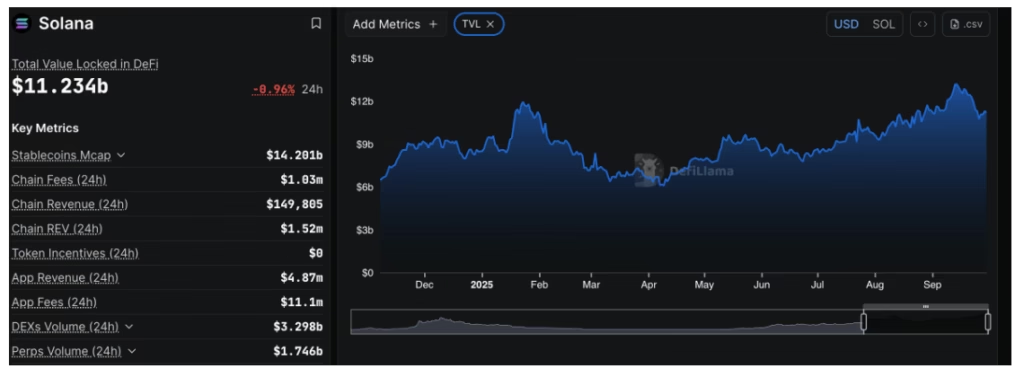
The reduction in staking balances highlights growing caution among investors. The DeFi sector’s health is closely tied to Solana’s price action, and a sustained decline in TVL could signal broader weakness in the ecosystem.
Negative Solana Funding Rates Indicate Bearish Sentiment
Solana’s derivatives market also reflects a risk-off mood. The Open Interest (OI) weighted funding rate has turned negative, indicating that traders are increasingly taking short positions. Negative funding rates often signal declining confidence among long holders, suggesting the market could see further downward pressure in the coming days.

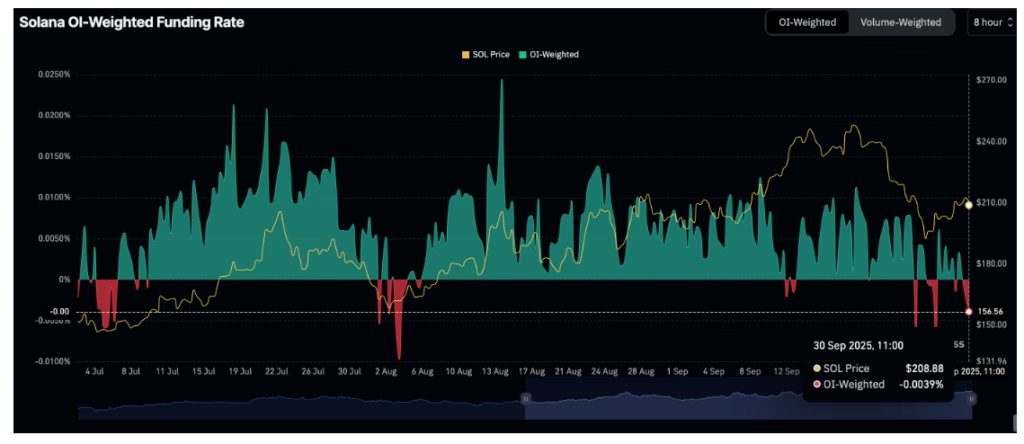
Monitoring the SOL OI-weighted funding rate will be crucial, as it may provide early insight into whether the token can rebound above $220 or continue toward losses under $200.
Technical Outlook Suggests Further Pullback
From a technical perspective, SOL trades below the 50-day Exponential Moving Average (EMA) at $208, facing resistance under $215. The Relative Strength Index (RSI) has dropped to 44, signaling growing bearish momentum. Additionally, the Moving Average Convergence Divergence (MACD) has maintained a sell signal since September 21, further reinforcing the risk of a deeper correction.

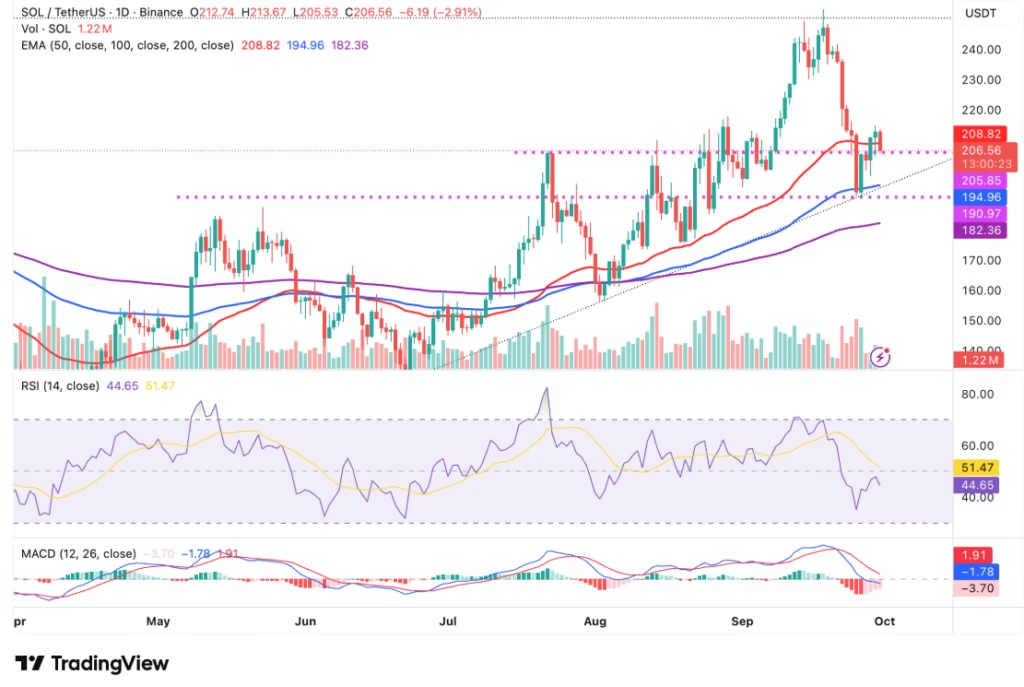
Support levels to watch include the 100-day EMA at $194 and the 200-day EMA at $182. Conversely, a rebound above the 50-day EMA could set the stage for renewed gains toward $220 and $250.
Solana is at a pivotal juncture, with both DeFi activity and derivatives market signals pointing to potential downside risk. Traders should remain vigilant, especially if the price breaches $200, while keeping an eye on technical indicators for signs of recovery.
ALSO READ:Why Solana Is Falling Faster Than Other Cryptocurrencies and What’s Next
DISCLAIMER:
The views and opinions expressed herein are solely those of the author and do not necessarily reflect the views of the publisher. The publisher does not endorse or guarantee the accuracy of any information presented in this article. Readers are encouraged to conduct further research and consult additional sources before making any decisions based on the content provided.