- Stellar XLM is testing key support at $0.38 amid mixed technical signals, with long-term bullish trends still intact despite short-term bearish pressure.
- Traders should watch for a confirmed bounce above $0.40 or a potential dip toward $0.33 in the coming days.
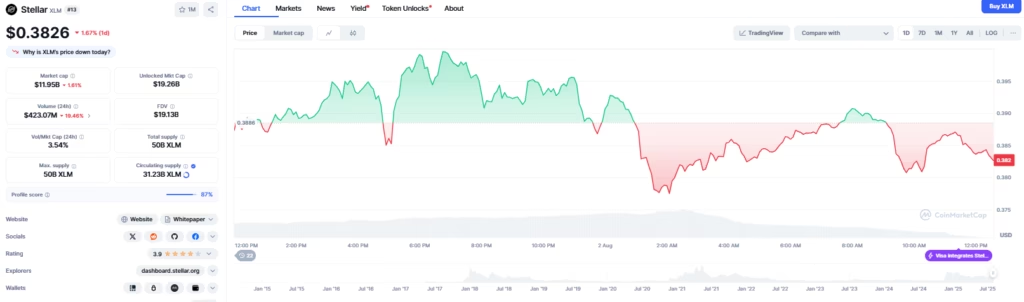
Stellar’s native token, XLM, has recently dropped to test a critical support level at $0.38. Despite this near-term weakness, the coin’s long-term bullish trend remains intact, leaving traders divided on its next move. Here’s a detailed look at the current technical landscape shaping XLM’s price action.
Stellar XLM Price Decline Reflects Broader Market Trends
The recent 2.47% drop in XLM price to $0.38 is not linked to any significant news or developments within Stellar’s ecosystem. Instead, the movement seems driven by general cryptocurrency market sentiment and technical factors. With moderate trading volume of about $44.9 million on Binance spot markets, the market is in a consolidation phase, prompting traders to focus on key support and resistance levels rather than fundamentals.
Mixed Technical Indicators Create Uncertainty
Stellar’s technical indicators paint a mixed picture:
- RSI at 46.32: Positioned in neutral territory, it signals neither overbought nor oversold conditions, suggesting potential movement in either direction.
- MACD Histogram at -0.0143: Shows bearish momentum, hinting at short-term downward pressure.
- Stochastic %K and %D near 6.4: These oversold readings hint at a possible bounce, but confirmation from price action is needed.
Meanwhile, XLM trades below its short-term moving averages—the 7-day SMA at $0.41 and 20-day SMA at $0.44—but stays above the critical 50-day ($0.33) and 200-day SMA ($0.31). This supports the longer-term bullish outlook despite current challenges.
Key Stellar Support and Resistance Levels
The $0.38 mark acts as immediate support, aligned with the lower Bollinger Band, making it a critical defense zone for bulls. On the upside, resistance lies at $0.52, with a potential target of $0.56 if XLM can break past this level.
Long-term holders find comfort in the robust support around $0.22, the 52-week low, which provides a strong downside buffer.
Should You Consider Buying XLM Now?
Risk-averse traders should wait for confirmation above $0.40, signaling that support is holding. This approach offers a favorable risk-to-reward ratio, targeting $0.44 resistance.
Aggressive investors might consider buying near $0.38 due to oversold technical signals, but should be cautious of potential dips to $0.33 if the 50-day SMA fails.
Conclusion: The Next 48 Hours Are Pivotal
XLM’s price action over the next couple of days will be decisive. Holding above $0.38 could trigger a rebound towards $0.44, while a break below may lead to deeper corrections. Traders should closely monitor broader market trends and volume, as Stellar-specific news remains absent. This mixed technical environment calls for cautious but alert trading strategies.
DISCLAIMER:
The views and opinions expressed herein are solely those of the author and do not necessarily reflect the views of the publisher. The publisher does not endorse or guarantee the accuracy of any information presented in this article. Readers are encouraged to conduct further research and consult additional sources before making any decisions based on the content provided.