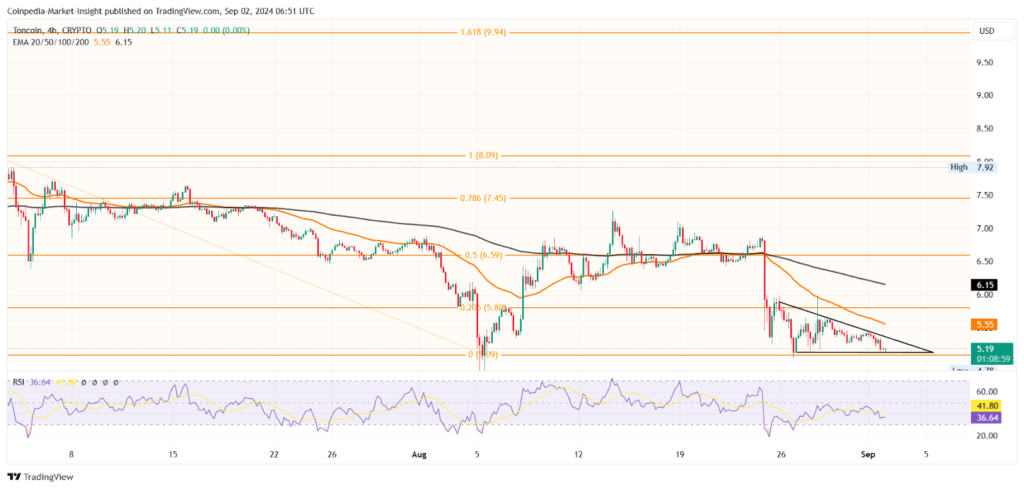
- Toncoin’s price has recently struggled to maintain its $5 support amid a bearish trend, with a significant 10.23% drop in the past week.
- Technical indicators and market conditions suggest potential further declines, with critical support levels potentially breaking down if bearish momentum persists.
As one of the top 10 cryptocurrencies by market cap, Toncoin (TON) has faced significant turbulence recently. With a market cap of $13.14 billion, the cryptocurrency is experiencing a notable downturn, having dropped by 10.23% in the past week and 16.26% the week before. As bearish momentum continues to build, the crucial question remains: Can Toncoin sustain its support at the $5 level?
Toncoin’s Recent Price Performance
The recent dip in Toncoin’s price followed the news of Pavel Durov’s release on a bail amount of $5.56 million. This development initially saw Toncoin consolidate just above the psychological $5 mark. However, the price experienced a dramatic three-day crash of 24%, hitting the $5 level and creating a volatile sideways trend that hints at a potential breakdown.

On Sunday, Toncoin saw a 4.43% drop, resulting in a significant variation in the candle, but the $5 support level has managed to hold firm, temporarily staving off a deeper bearish continuation. Despite this, the price action is increasingly fragile, reflecting the market’s uncertainty.
Technical Indicators and Trends
Examining the 4-hour chart reveals a negative cycle within a triangle pattern formed during this sideways range. The descending triangle pattern suggests a possible breakdown rally, which could extend the bearish phase if it materializes. Additionally, the 50 EMA and 200 EMA on the 4-hour chart have formed a ‘death cross,’ signaling a bearish trend reversal. The daily chart further exacerbates the concern, as the 50D and 200D EMA are nearing a similar death cross.
Fibonacci Levels and Potential Support
For those tracking Toncoin’s price action, the Fibonacci levels offer insight into potential resistance and support zones. The key resistance levels are positioned at $5.80 and $6.59, corresponding to the 23.60% and 50% Fibonacci retracement levels, respectively. Should the price attempt a breakout rally, it may encounter resistance around the 50 EMA at $5.55.
Conversely, if the price fails to maintain the $5 support, the next significant support levels are at $4.31 and $3.49. The overall sentiment remains cautious, with Toncoin’s price action highly susceptible to further news developments related to Durov’s case.
Will Toncoin Hold Its Ground?
Toncoin’s price is at a critical juncture. With bearish signals growing stronger and technical indicators suggesting potential downtrends, the $5 support level is under intense scrutiny. Investors and traders alike will need to monitor both technical indicators and news developments closely to gauge whether Toncoin can weather the current storm or if further declines are on the horizon.


