


- TRON generated $23.85 million in monthly revenue, nearly four times Ethereum’s $6.04 million.
- Ethereum, however, has a much higher valuation multiple than TRON.
TRON has overtaken Ethereum in monthly Layer 1 revenue, generating $23.85 million compared with Ethereum’s $6.04 million. The figures highlight a sharp difference between the revenue reported by the two blockchain networks and their valuations, with TRON recording a much lower annualized revenue multiple than Ethereum.
Data shared by Whale Factor places TRON ($TRX) ahead of nine competing networks in the monthly revenue ranking. However, the figures cover base-layer revenue and exclude some earnings generated by applications built on these networks.

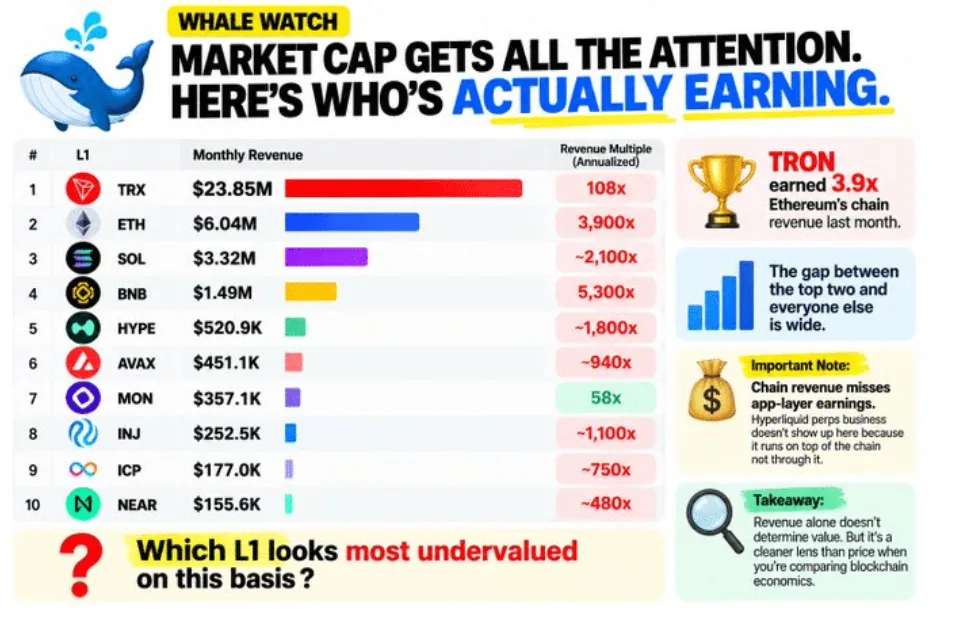
TRON Leads Ethereum and Solana in Monthly Layer 1 Revenue
TRON recorded $23.85 million in monthly revenue, nearly four times Ethereum’s $6.04 million. The difference between the two networks reached $17.81 million during the measured period.
Solana ($SOL) ranked third with $3.32 million in monthly revenue, followed by BNB at $1.49 million. The gap between TRON and the other networks highlights its strong performance in the reported revenue comparison.
Hyperliquid ($HYPE) recorded $520,900, while Avalanche ($AVAX) generated $451,100. Monad ($MON), Injective ($INJ), Internet Computer ($ICP), and NEAR completed the ranking.
TRON’s lead does not necessarily mean it has a larger overall ecosystem than Ethereum. The figures measure reported blockchain revenue rather than total economic activity, user adoption, or the value of applications operating on each network.
TRX and ETH Valuations Show a Wide Gap
The revenue comparison also highlights differences in how the market values blockchain tokens relative to the revenue generated by their networks.
According to the figures, TRX has an annualized revenue multiple of 108 times, while Ethereum’s multiple approaches 3,900 times. Monad has a multiple of 58 times, and BNB exceeds 5,300 times.
These multiples compare a token’s market valuation with annualized network revenue. A higher multiple can reflect expectations of future growth, while a lower multiple may indicate that the market assigns less value to each unit of reported revenue.
However, a lower multiple does not automatically make a cryptocurrency undervalued. Investors also consider revenue growth, token supply, network adoption, and future demand when assessing an asset.
Ethereum’s higher multiple suggests that its market valuation extends well beyond the revenue captured in this comparison. Its broader ecosystem and expectations for future activity may influence that valuation, although the figures alone cannot establish whether the market has priced those factors correctly.
TRON’s lower multiple, meanwhile, may attract attention from investors comparing network revenue with token valuations. Whether that difference represents an opportunity depends on factors beyond the monthly ranking.
Why Layer 1 Revenue Does Not Tell the Full Story
The comparison has an important limitation: base-layer revenue does not include all earnings generated by applications operating on a blockchain.
For example, Hyperliquid’s perpetual futures business operates on top of its underlying infrastructure. Its reported base-layer revenue of $520,900 does not capture all the revenue generated by the application itself.
This distinction matters because blockchain networks have different economic structures. Some fees accrue at the base layer, while applications generate revenue through trading, lending, and other services.
As a result, a network with lower reported Layer 1 revenue may still support applications that generate substantial economic activity. Comparing base-layer figures alone can overlook this contribution.
The data also provides a snapshot of monthly performance rather than a long-term revenue trend. Network revenue can change with transaction demand, fees, and market conditions. Annualizing one month of revenue assumes that the activity will continue at a similar rate, which may not happen.
Furthermore, network revenue does not automatically translate into earnings for token holders. The relationship depends on each network’s economic model and how it distributes or uses the fees it collects.
What TRON’s Revenue Lead Means for Investors
TRON’s $23.85 million in monthly revenue puts it well ahead of Ethereum, Solana, and the other networks included in the comparison. Its 108-times annualized revenue multiple also contrasts sharply with Ethereum’s nearly 3,900-times multiple.
However, these figures do not establish which cryptocurrency offers better value. Revenue performance, token valuation, application earnings, and future demand all play a role in assessing a blockchain ecosystem.
For investors, the key question is whether TRON can sustain its revenue lead and how its valuation compares with the economic activity supported by its network. Ethereum’s broader ecosystem also needs to be considered when assessing its higher multiple.
For now, the data shows a clear difference between the two networks: TRON leads in reported monthly Layer 1 revenue, while Ethereum commands a substantially higher valuation relative to its reported revenue. Whether that gap narrows will depend on how network activity, revenue, and market expectations evolve.
ALSO READ: Ripple Wins Final US Approval for National Trust Bank as RLUSD Market Cap Hits $2.5 Billion
DISCLAIMER:
This article reflects the author’s views and is provided for informational purposes only. While we strive for accuracy, the publisher does not guarantee that all information is complete or current. Readers should verify important information and consult appropriate sources before making decisions based on this content.