
- Uniswap price shows strong technical support and high trading volume near $1 billion, signaling potential bullish momentum.
- Key indicators and patterns suggest a possible breakout above $9.50 if current levels hold.
Uniswap (UNI) remains a top focus for crypto traders as it navigates a mild pullback but holds onto key technical support levels. With nearly $1 billion in trading volume recently recorded, analysts see a cautiously optimistic outlook for UNI’s price movement in the coming days.
Breakout Setup Gains Market Attention
Earlier this week, Uniswap triggered a breakout from a prolonged consolidation zone above the $9.19 resistance level. This move sparked renewed interest among traders, with many eyeing an entry around current prices and a profit target near $9.51 — a range supported by historical resistance and Fibonacci extension levels.
Risk management remains a priority, with stop-loss placement just below $9.11 to protect against unexpected drops. Experts recommend limiting capital exposure to 5%, reflecting the volatile nature of the crypto market.
Recent candlestick patterns show wicks during dips, signaling underlying buying demand and lending strength to the bullish case.
Uniswap On-Chain Strength and Market Activity
As of mid-July 2025, Uniswap trades around $8.73, down just under 2% on the day, yet boasts a market cap exceeding $5.35 billion. This ranks UNI 35th among cryptocurrencies by market value. Trading volume is high, near $980 million in 24 hours, highlighting strong participation from both retail and institutional investors.
With a circulating supply of about 600 million UNI tokens, Uniswap benefits from robust liquidity, facilitating smooth transactions and price stability. Price action between $8.60 and $9.20 has formed a potential base pattern, and a confirmed move above this range could accelerate bullish momentum.
Crypto analyst Crypto Joe identified an inverted head and shoulders pattern on a 30-minute chart, projecting a price target of $8.93. This aligns with other bullish indicators across multiple timeframes, suggesting converging positive signals.
Uniswap Indicators Show Strength in Price Action
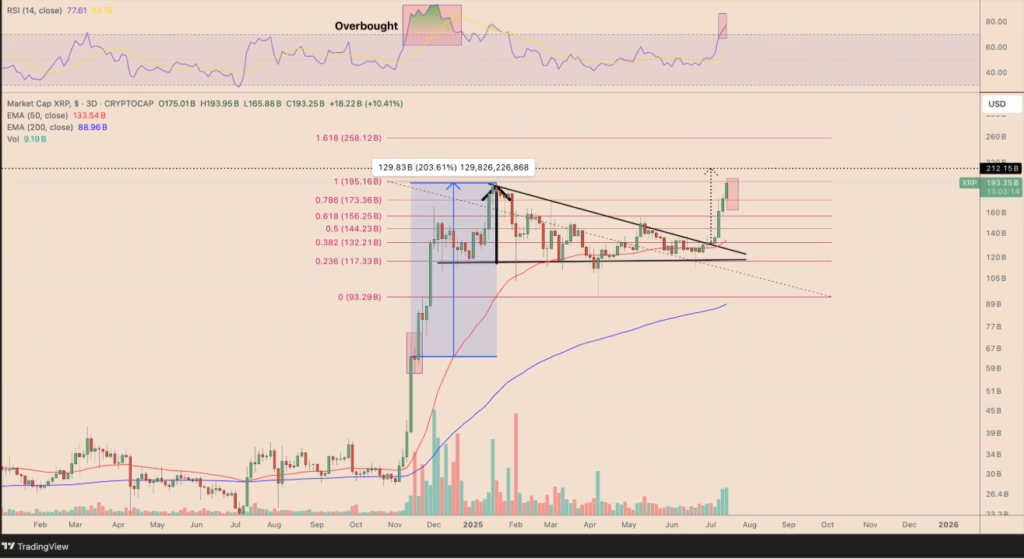
Technical indicators reinforce the optimistic outlook. The daily UNI/USDT chart shows price action near the upper Bollinger Band at $9.49, with the 20-day moving average sitting at $7.91. This positioning points to strong buying interest but also hints at possible short-term corrections due to overbought conditions.
The Bollinger Band Power (BBP) reading of 0.929 further confirms sustained bullish momentum since June, signaling that current price moves are supported by genuine demand rather than speculative spikes.
What Traders Should Watch
Traders should closely monitor trading volume and price reactions around key support levels to validate whether Uniswap’s recent breakout can hold. If sustained, UNI could retest higher resistance zones, offering promising opportunities in a market that remains dynamic and fast-moving.
Uniswap’s solid on-chain fundamentals and technical patterns make it a compelling asset to watch as crypto markets continue to evolve.


