


- Uniswap (UNI) is approaching a key resistance level at $7.50, with bullish daily indicators suggesting a possible breakout toward $10.
- However, mixed signals on the weekly chart mean the token’s future direction remains uncertain.
Uniswap (UNI) has been quietly climbing after avoiding a significant drop in April 2025. Now, UNI is testing a critical resistance level around $7.50, sparking speculation about whether it can break out and surge toward the $10 mark. Let’s explore the recent price action, technical signals, and what could be next for this leading decentralized exchange token.
ALSO READ:Ethereum Price Surge Continues: Is $3,000 Within Reach in May 2025?
Steady Climb Along a Long-Term Support
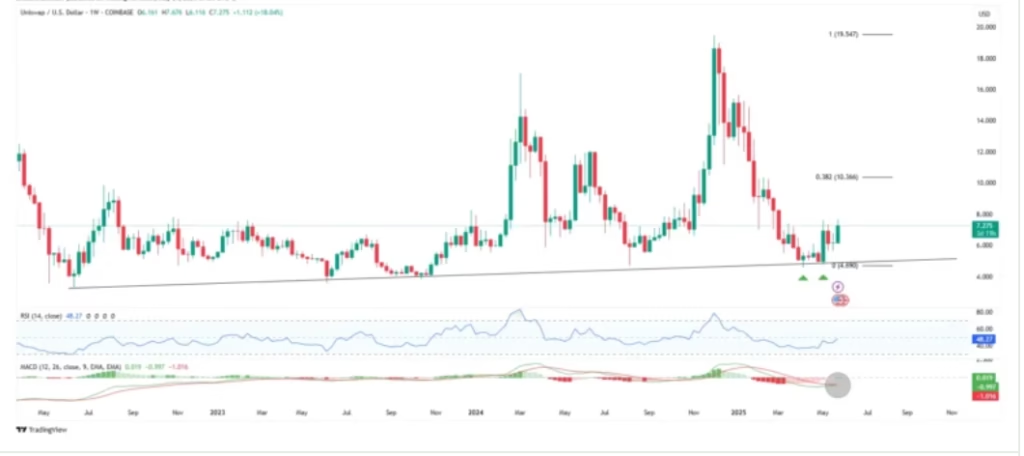
UNI’s price has followed a steady upward path since July 2022, supported by a strong ascending trendline visible on the weekly chart. This trendline has held firm through several retests, including notable bounces in April and May 2025. The latest bounce was highlighted by a bullish engulfing candlestick — a classic indicator that often signals a potential price reversal.
Despite these positive technical signs, UNI’s recovery has been relatively muted compared to broader cryptocurrency market gains. It still has not reached the 0.382 Fibonacci retracement level at around $10.35, a typical milestone for assets rebounding after a correction. This shortfall hints at underlying weakness still present in the trend.

Mixed Signals from Uniswap Strength Indicators
Examining the weekly momentum indicators paints a mixed picture. The Relative Strength Index (RSI) is rising but remains below the neutral 50 level, signaling that buying pressure is still moderate. Similarly, the Moving Average Convergence Divergence (MACD) is showing signs of improvement but is yet to move fully into bullish territory. A bullish crossover is possible soon, though, which could support further gains.
Overall, the weekly chart does not yet confirm a full bullish trend for UNI but maintains a stable technical structure.
Key Breakout at $7.50 Could Define UNI’s Next Move
The daily chart shows more encouraging signs. UNI successfully broke out of a descending resistance line in mid-April and is now making a second attempt to surpass the $7.50 resistance zone. This time, the daily RSI and MACD are bullish and positioned above key thresholds, increasing the chances of a successful breakout.

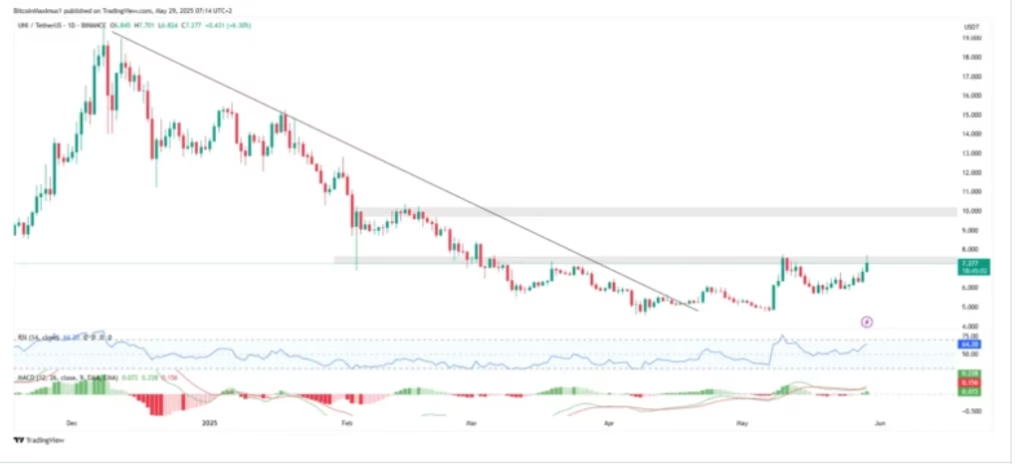
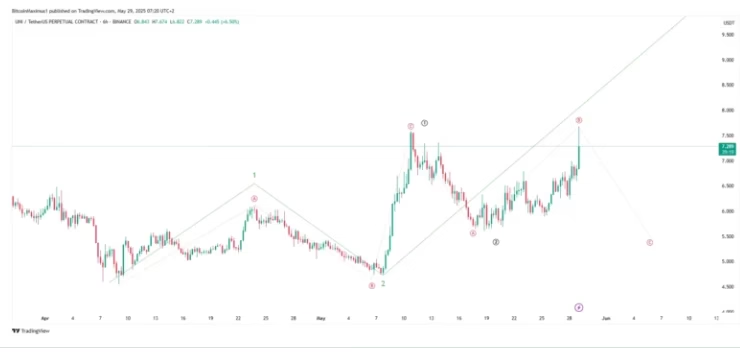
If UNI breaks above $7.50 decisively, it could unlock momentum toward the $10 level. However, some bearish scenarios remain possible based on wave pattern analyses, which could see UNI struggling below this resistance.

Uniswap’s price recovery since April has been cautious, with the token still battling the critical $7.50 level. A clear breakout here is essential for UNI to join the broader market rally and target double-digit prices. Traders and investors will be watching this level closely in the coming days to gauge whether the token’s recent upward trend can continue or if resistance holds firm.
MIGHT ALSO LIKE:How ONDO and Chainlink Are Transforming the Future of Financial Markets
DISCLAIMER:
The views and opinions expressed herein are solely those of the author and do not necessarily reflect the views of the publisher. The publisher does not endorse or guarantee the accuracy of any information presented in this article. Readers are encouraged to conduct further research and consult additional sources before making any decisions based on the content provided.