- VeChain (VET) recently experienced a 6% gain despite a month-long downward trend in the cryptocurrency market.
- Analysts highlight critical support and resistance levels that could determine VET’s near-term price direction.
Amid the ongoing correction in the cryptocurrency market, VeChain (VET) is striving for a comeback, showing a 6% uptick over the last 24 hours. Despite this recent gain, the past month has seen substantial setbacks, with a decline of 32%, and in the last week alone, it has faced a roughly 10% drop. Currently, VeChain encounters strong resistance at $0.0211, posing a barrier to achieving a definitive upward breakthrough.
Analyzing the Current Trends
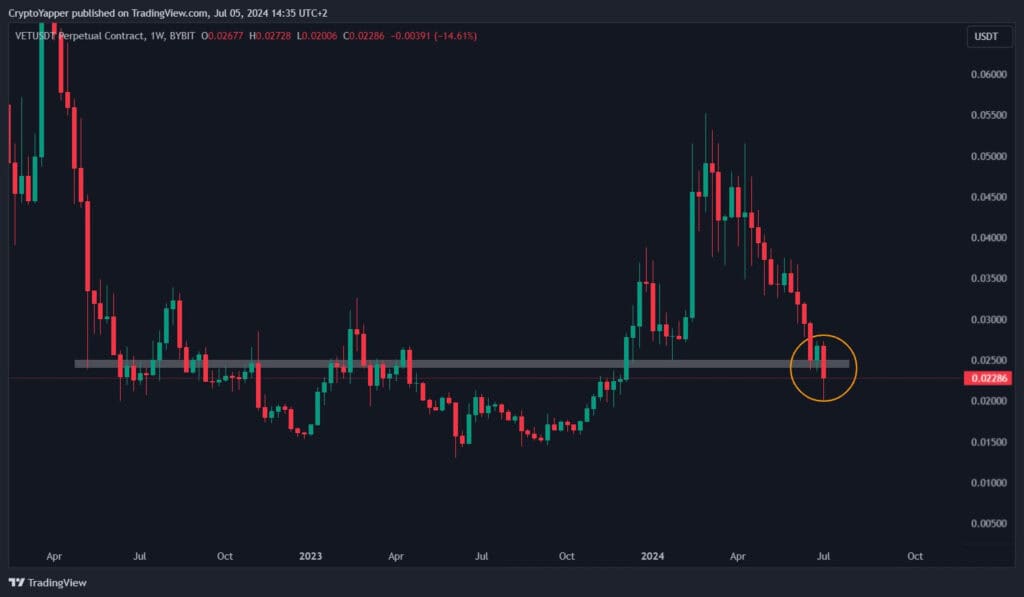
Crypto analyst Yapper recently analyzed VeChain (VET) against the US dollar (USDT) over a weekly timeframe, suggesting a critical juncture for the token. He indicates that VET has been descending over the past few months and is now hovering around a significant support level, trying to maintain its position above this pivotal threshold.

Currently, VET’s price is approximately $0.0238, dipping from a high of $0.0264 within the same week. The analyst points out that if VET closes the week below this support level, it could signal further downside potential. Conversely, a close above the support would be interpreted as a bullish signal, suggesting a possible reversal or stabilization in the near term.
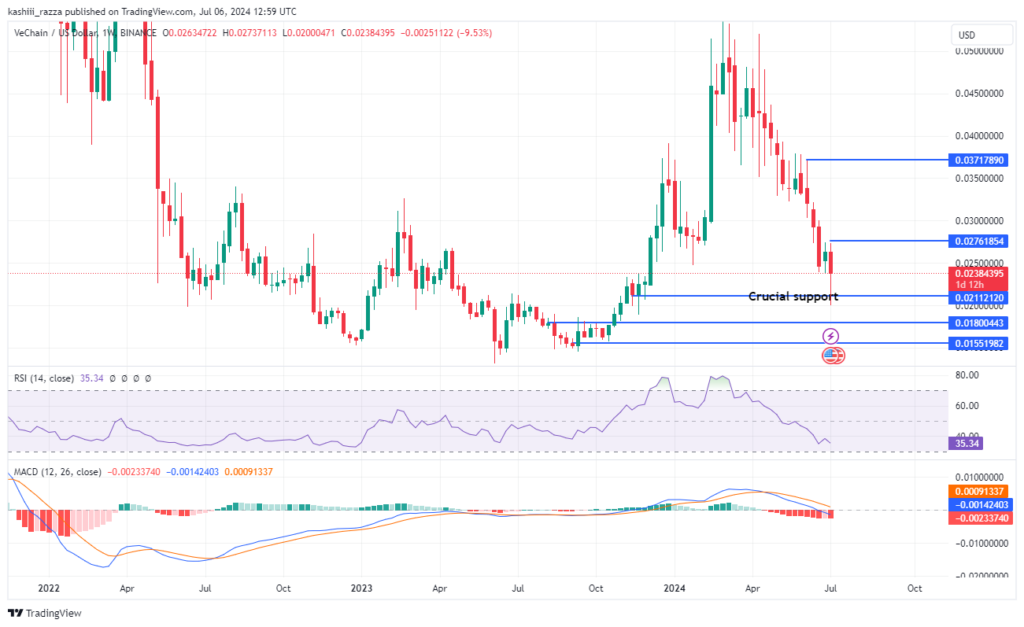
As of now, VET’s price is at a critical juncture. If the critical support at $0.0211 is breached, the token may face further declines, potentially targeting the $0.018 support level if bearish pressures continue. A deeper fall could test the $0.015 mark, highlighting the importance of maintaining above this level.
On the flip side, immediate resistance lies at $0.027 and $0.037. Experts suggest that if VET surpasses the $0.027 peak observed on July 1, the token could ascend to June’s high of $0.037, provided that the bullish momentum gains strength. Overcoming this resistance is pivotal for achieving a sustained recovery and upward trajectory.
Technical Indicators and Market Sentiment

The Relative Strength Index (RSI) is at 35.34, nearing oversold levels. This suggests that selling pressure might be nearing exhaustion, potentially attracting buyers. However, the Moving Average Convergence Divergence (MACD) indicator shows a bearish trend, with the MACD line crossing below the signal line and negative histogram bars, indicating that bearish momentum could persist in the short term.
VeChain is at a decisive point, balancing between recovery and further decline. The market’s reaction to key support and resistance levels will likely shape VET’s near-term trajectory. Investors should closely monitor these levels to gauge potential movements in VET’s price.


