Skip to content
Crypto News Focus logo CNF_CRYPTO_NEWS_FOCUS_LOGO 8

Crypto News Focus

your day to day crypto news site

Primary Menu
  • Home
  • News
    • Bitcoin News
    • Ripple XRP news
    • Ethereum News
    • Cardano News
    • Shiba Inu News
    • Pi Network News
    • More
  • Analysis
  • PR Desk
  • About Us
  • General Policy & Privacy
  • Guides
    • Bitcoin Guides
    • Pi Network Guide
    • Cardano Guide
  • Politics
  • Tech
  • Home
  • News
  • Warning Signs for XRP as Price Shows Risk of Pullback Before Next Rally
  • Analysis
  • News

Warning Signs for XRP as Price Shows Risk of Pullback Before Next Rally

Jane Kariuki 15 May 2025
XRP image
  • XRP is showing signs of a short-term pullback, with bearish patterns like a double top and rising wedge pointing to a possible drop to $1.94.
  • However, long-term indicators remain optimistic, with projections suggesting potential gains up to $17 if key support levels hold.

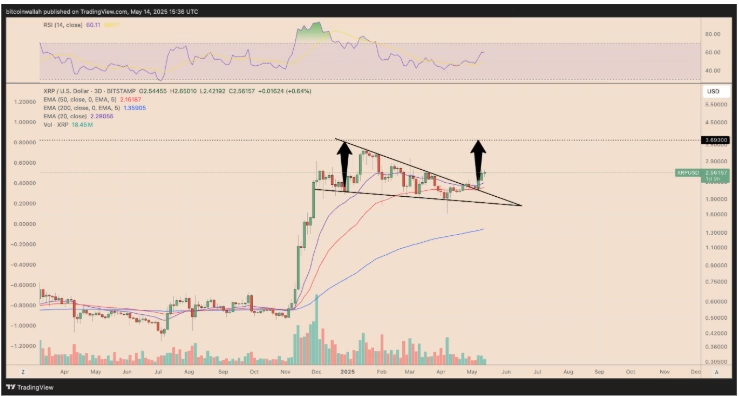
XRP has surged over 50% in the past month, climbing from $1.80 to $2.47, driven by renewed investor interest and expectations of an impending altseason. However, technical indicators now suggest that this rally may be losing momentum, and a short-term correction could be on the horizon.

Bearish Patterns Signal Near-Term Trouble

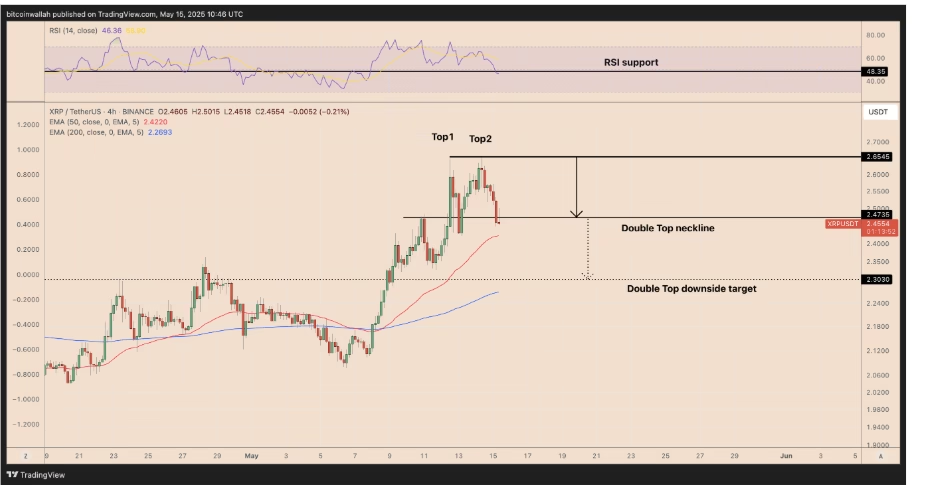
XRP’s price action has formed a double top pattern near $2.65, with a neckline at $2.47. The drop below this neckline confirms a potential bearish reversal, signaling a likely move toward $2.30.

XRP / USD PRICE CHART FOR 4 HOURS PERIOD
XRP/USD four-hour price chart. Source: TradingView

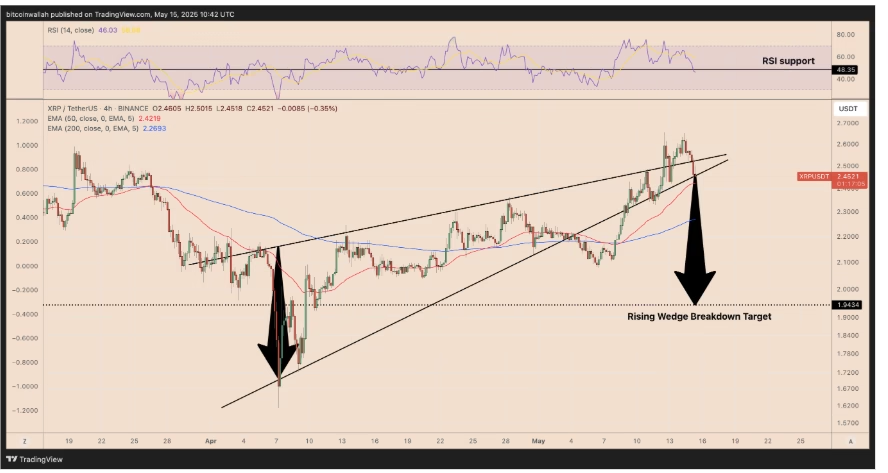
Adding to the concern is a rising wedge breakdown, typically a bearish signal that could drive XRP down by another 20% to around $1.94. This level is significant because it overlaps with a highly leveraged long position zone, where a breakdown could trigger forced liquidations and intensify the sell-off.

XRP /USD PRICE CHART FOR FOUR HOUR DURATION
XRP/USD four-hour price chart. Source: TradingView

On-Chain Metrics Echo Warning Signs

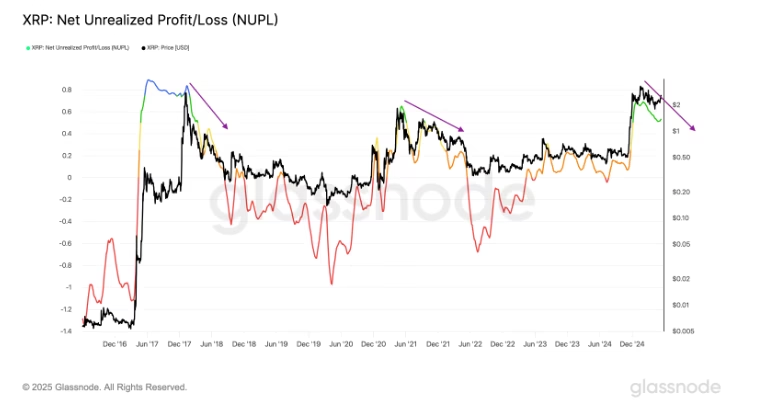
XRP’s Net Unrealized Profit/Loss (NUPL) metric has entered the Belief–Denial zone, a phase that has historically preceded sharp declines. This suggests that while many traders still anticipate further gains, the actual momentum may be fading — a potential red flag echoed in past market cycles.

XRP NUPL 30-day average vs. price chart
XRP NUPL 30-day average vs. price chart. Source: Glassnode

Long-Term Projections Still Favor Bulls

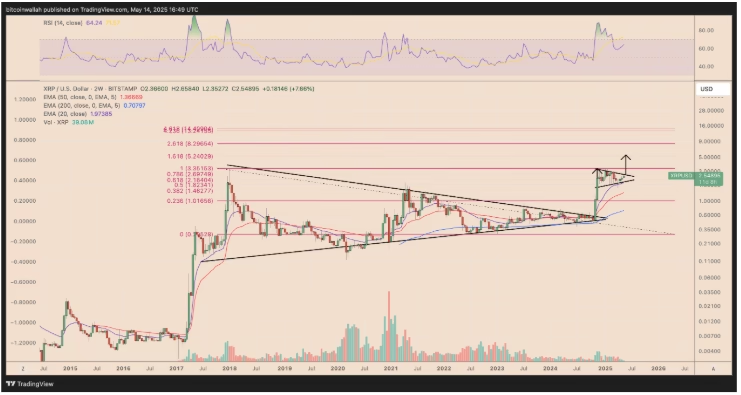
Despite the short-term risks, XRP’s long-term charts remain bullish. A breakout from a multi-month falling wedge could fuel a rally toward $3.69 by June, provided it holds above key moving averages.

XRP /USD three-day price chart.
XRP/USD three-day price chart. Source: TradingView

Broader projections even point to targets of $5.24 and $17, based on symmetrical triangle formations and Fibonacci extension levels.

XRP /USD two-week price chart.

In conclusion, while XRP’s short-term outlook appears shaky due to bearish technical patterns and sentiment metrics, the broader trend continues to favor upside potential. Traders may see a temporary pullback, but the long-term bull case remains intact — at least for now.

ALSO READ:Can Cardano ADA Hit $2 in Q3 2025? Analysts Optimistic

DISCLAIMER:
The views and opinions expressed herein are solely those of the author and do not necessarily reflect the views of the publisher. The publisher does not endorse or guarantee the accuracy of any information presented in this article. Readers are encouraged to conduct further research and consult additional sources before making any decisions based on the content provided.

Continue Reading

Previous: XRP Price Uptrend Strengthened by $1 Billion Surge in Futures Open Interest
Next: Bitcoin Mining Just Got Tougher — But Some Are Winning Big

Related Stories

VeChain chart showing rising channel pattern signaling potential breakout in 2026
  • Analysis

Can VeChain (VET) Hit $0.040 by August 2025? Latest Price Forecast

Sean Williams 26 July 2025
Pi NETWORK on black
  • Analysis

Pi Network Token Struggles Below $0.45 But Core Team Sees Signs of a Reversal

vivian 25 July 2025
Bitcoin BTC INTERCONNECTED
  • Analysis

Bitcoin Price Drops to $115K as Ethereum Surges Past $3,600

Jane Kariuki 25 July 2025

For general inquiries, please email us at Info@cryptonewsfocus.com

Crypto news focus is your day-to-day crypto news site. Get all the latest News and trends in the crypto, blockchain, and DeFi space. For more info and inquiries, reach out via email at info@cryptonewsfocus.com

You may have missed

VeChain chart showing rising channel pattern signaling potential breakout in 2026
  • Analysis

Can VeChain (VET) Hit $0.040 by August 2025? Latest Price Forecast

Sean Williams 26 July 2025
Pi NETWORK on black
  • Analysis

Pi Network Token Struggles Below $0.45 But Core Team Sees Signs of a Reversal

vivian 25 July 2025
Bitcoin BTC INTERCONNECTED
  • Analysis

Bitcoin Price Drops to $115K as Ethereum Surges Past $3,600

Jane Kariuki 25 July 2025
Solana on a purple buckground
  • News

Solana Price Drops Sharply Amid Market Liquidations and Legal Action

Cal Evans 25 July 2025

Social Media

Crypto News Focus © All rights reserved | MoreNews by AF themes.
Go to mobile version
We use cookies to ensure that we give you the best experience on our website. If you continue to use this site we will assume that you are happy with it.