


- Bitcoin, Ethereum, and XRP declined as traders took profits amid rising greed and a cautious market mood.
- Despite steady ETF inflows, key support levels will determine whether prices rebound or extend their correction.
Bitcoin Tests Key Support Near $121,000
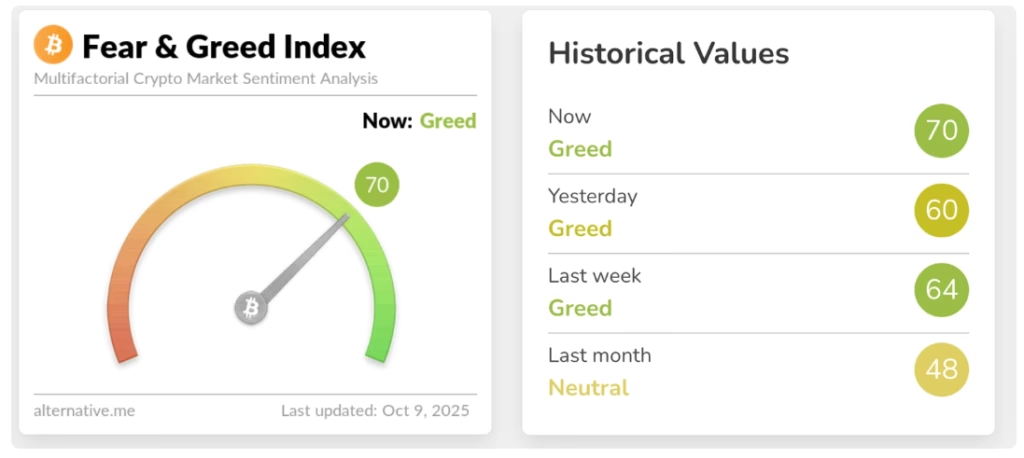
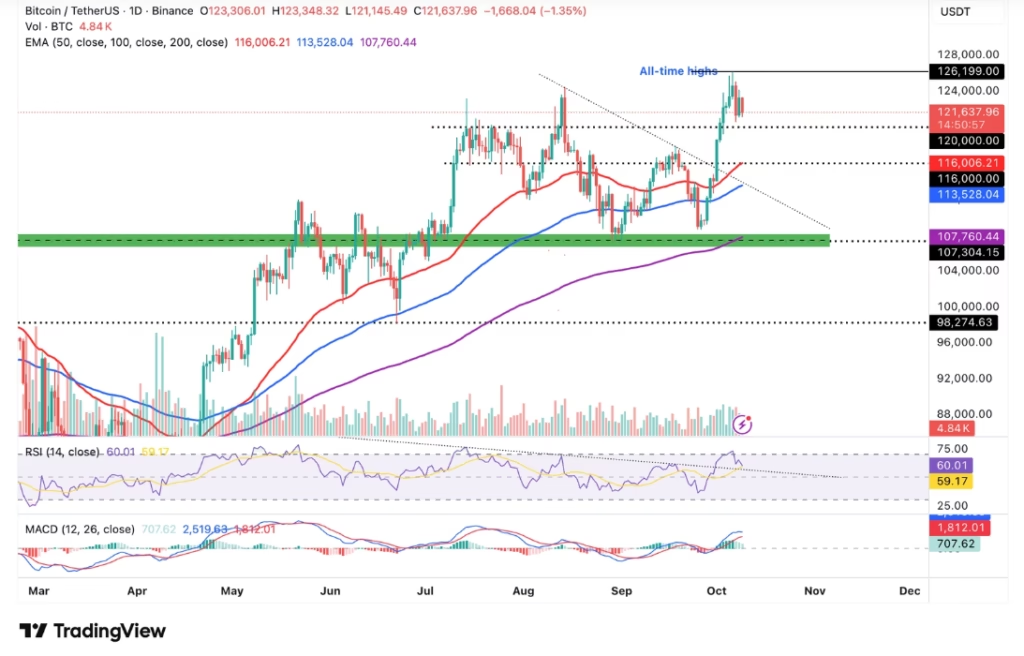
Bitcoin (BTC) slid on Thursday, erasing its previous day’s gains as the broader crypto market faced renewed selling pressure. Despite consistent ETF inflows, Bitcoin struggled to maintain its bullish pace, retreating to around $121,000. The Alternative.me Fear & Greed Index climbed to 70, signaling investor greed, which often precedes profit-taking phases.

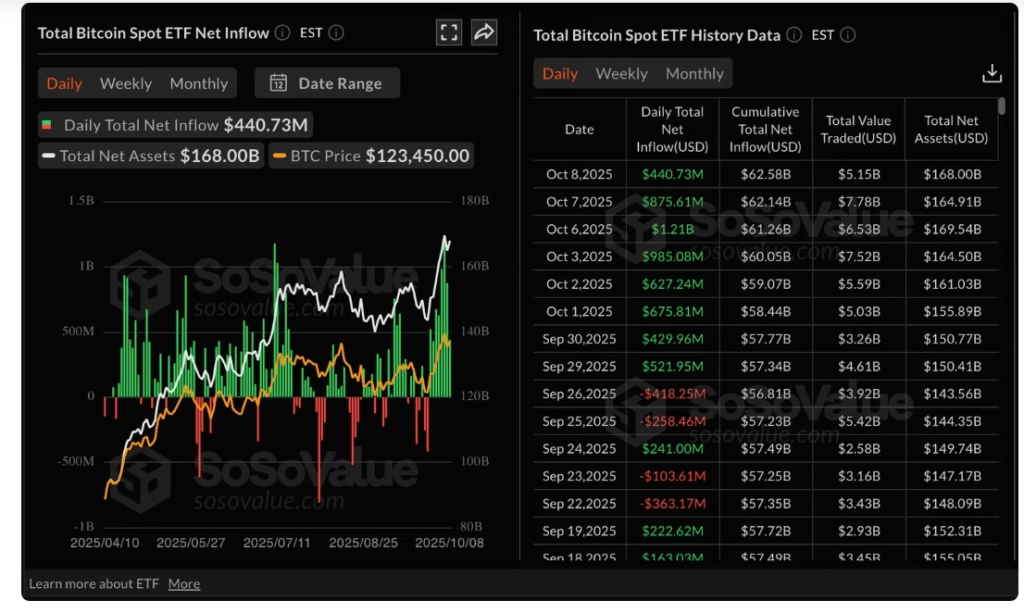
Spot Bitcoin ETFs recorded their eighth consecutive day of inflows, totaling $441 million and bringing cumulative inflows close to $63 billion.

This steady institutional demand suggests long-term optimism, though near-term corrections are likely. Analysts note that the $120,000 mark serves as psychological support—if it holds, Bitcoin could rebound toward its record high of $126,199. However, a break below this level may lead to a deeper pullback toward the 50-day EMA at $116,006.

Ethereum Nears 50-Day EMA as Bulls Await Rebound
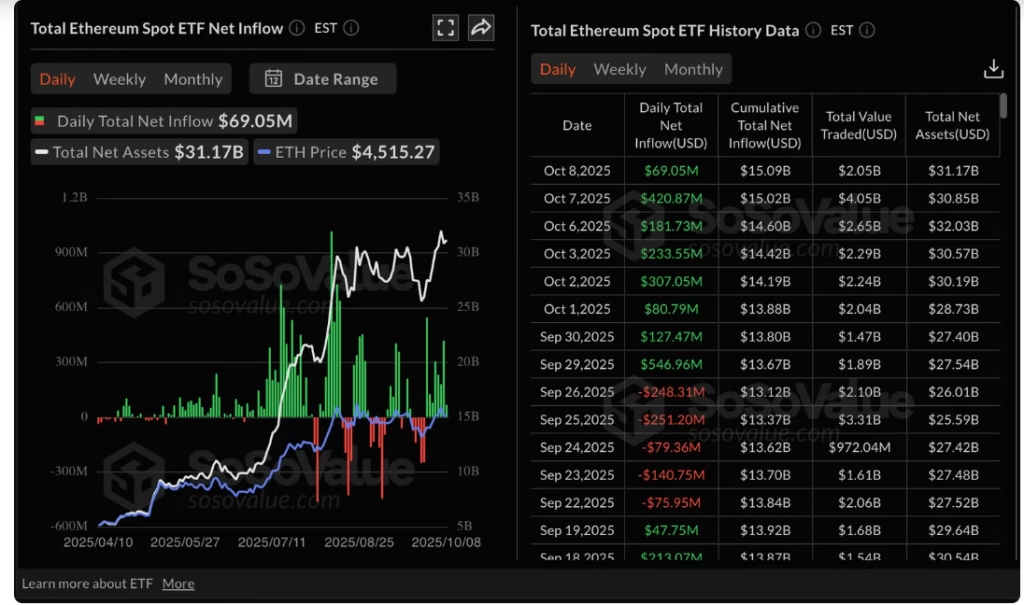
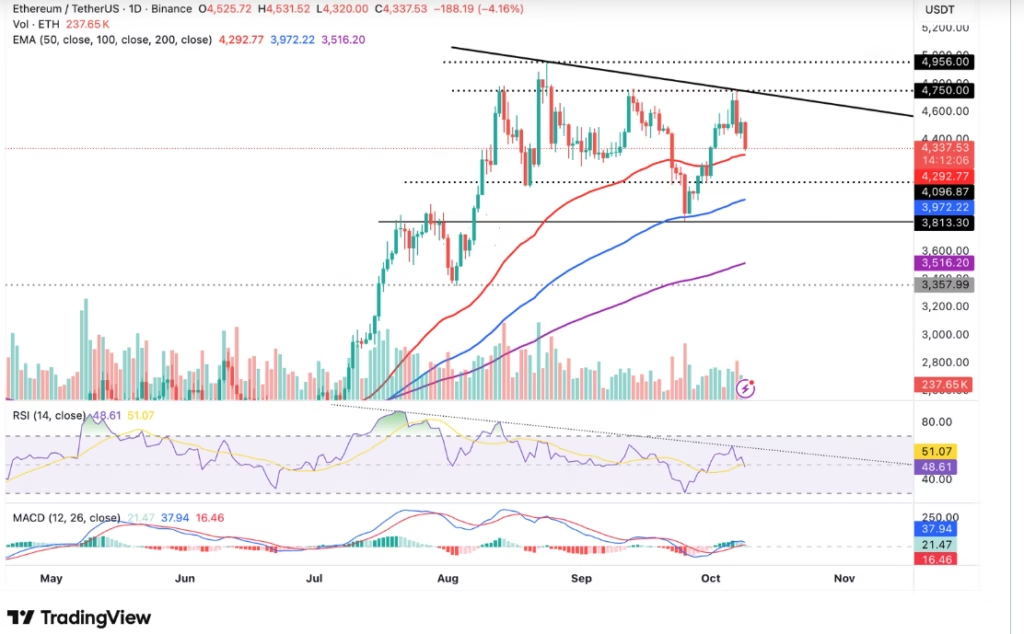
Ethereum (ETH) also slipped, approaching the 50-day Exponential Moving Average (EMA) near $4,292. The token’s Relative Strength Index (RSI) dropped to 48, showing weakening bullish strength. Institutional inflows into Ethereum ETFs fell to $69 million on Wednesday from $421 million the previous day, indicating cooling demand.

Although the Moving Average Convergence Divergence (MACD) indicator still holds a buy signal from early October, a narrowing gap between its lines hints that sellers may soon gain control. If bearish sentiment intensifies, Ethereum could test the crucial $4,000 support zone before any meaningful recovery attempt.

XRP Bears Take Control Below $2.85
XRP continued its decline, falling under the 100-day EMA at $2.85. The RSI dropped to 42, reflecting rising selling pressure as investors lock in profits amid broader market uncertainty. The MACD recently flashed a sell signal, reinforcing the bearish tone.

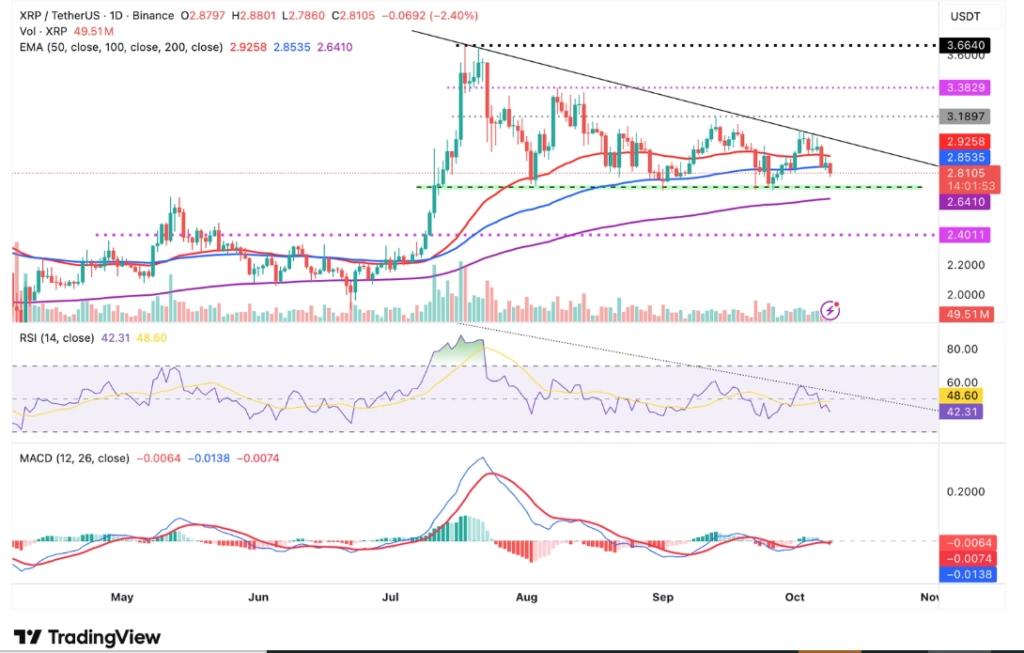
The next critical support zones for XRP lie between $2.70 and $2.64—levels that traders will watch closely for potential accumulation or further downside.
Market Outlook
Thursday’s retreat underscores a cautious sentiment across the crypto market. Despite strong ETF inflows for Bitcoin and moderate institutional interest in Ethereum, traders appear to be taking profits amid high greed readings. As long as major assets like BTC, ETH, and XRP hold key support levels, the broader uptrend remains intact—but a deeper correction cannot be ruled out if risk-off sentiment persists.
DISCLAIMER:
The views and opinions expressed herein are solely those of the author and do not necessarily reflect the views of the publisher. The publisher does not endorse or guarantee the accuracy of any information presented in this article. Readers are encouraged to conduct further research and consult additional sources before making any decisions based on the content provided.