
- Ethereum has rallied 18% recently, but key resistance levels, an RSI that’s not yet oversold, and uncertain macroeconomic conditions suggest the price could drop further.
- With support zones at $1,280-$1,160 and $890-$715, the outlook for ETH remains cautious, and investors should watch for upcoming economic events that could trigger more volatility.
Ethereum (ETH) has experienced an 18% rally recently, sparking hopes that the cryptocurrency might have found its bottom. However, some market analysts are cautious about calling a definitive reversal. Despite the uptick, there are several reasons to believe that Ethereum’s price could continue to decline. Let’s take a closer look at why ETH might not have hit its lowest point yet.
1. The Key Resistance Level Looms Large
Ethereum’s recent price action has seen it struggle with a critical resistance level at $1,630, a significant area dating back to February 2021. This level has proven to be a barrier in the past, and for the bulls to establish a sustained rally, they would need to turn it into a support floor. If ETH fails to maintain above this resistance, a further decline remains a strong possibility.
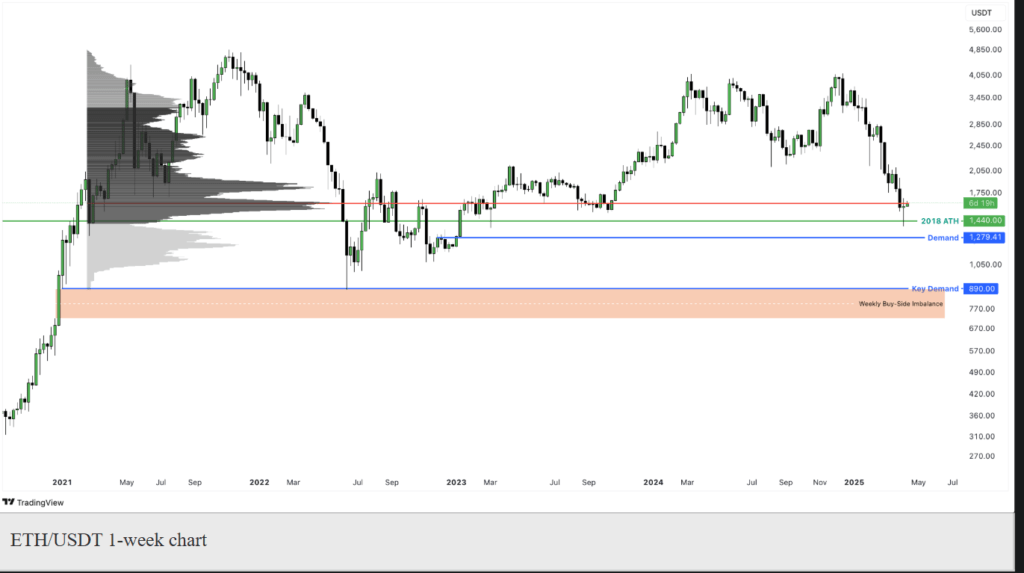
The $1,280-$1,160 range is the next key support level to watch. It’s a demand zone that was formed in late 2022 and has historically absorbed selling pressure. A drop into this zone could potentially set up another short-term rally. However, if ETH falls through this level, the next major support zone lies between $890 and $715, which could lead to more substantial price losses.
2. RSI Still Has Room to Fall
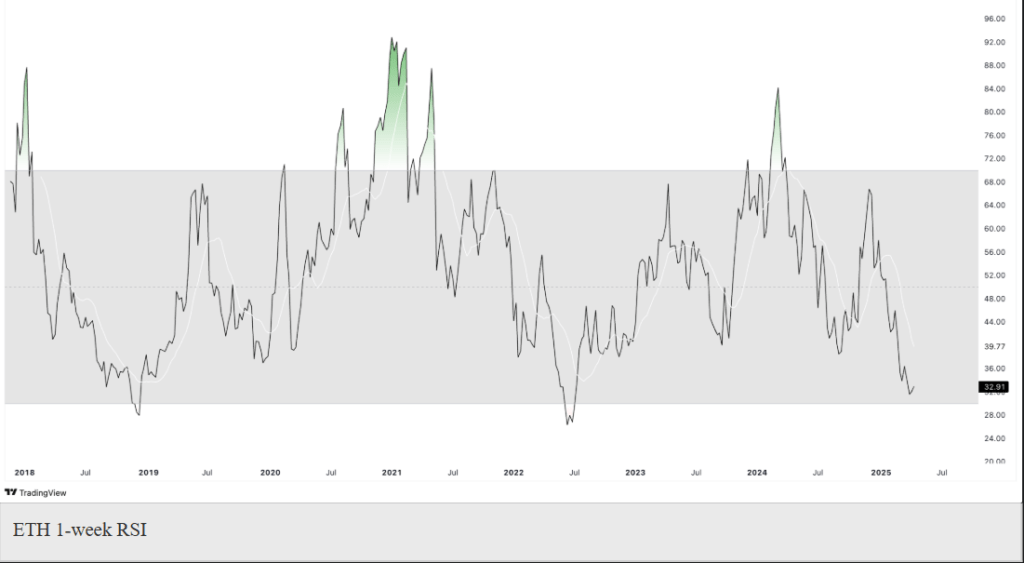
The Relative Strength Index (RSI) for Ethereum on the weekly chart is another indicator signaling the possibility of more downside. The RSI, a momentum oscillator used to assess whether an asset is overbought or oversold, has not yet entered the oversold territory. Historically, ETH has seen strong price rallies when the RSI hits oversold levels, suggesting that a drop to these levels could trigger a stronger move downward before any substantial reversal occurs.
3. Uncertainty in the Macroeconomic Landscape
Macroeconomic factors also play a crucial role in Ethereum’s price movement. With ongoing tensions between the US and China, including the Trump-Xi trade war, global markets are experiencing heightened volatility. This uncertainty is reflected in both the stock and crypto markets, which adds pressure to the broader market sentiment.
Furthermore, key economic events, including speeches from Federal Reserve Chairman Jerome Powell and upcoming inflation data, could introduce more market turbulence. If these events bring negative news, Ethereum could experience another downturn, especially if the broader financial markets enter a bearish phase.
Conclusion: A Cautious Outlook for Ethereum
While Ethereum’s recent rally has sparked some optimism, the overall outlook for ETH remains neutral-to-bearish. Key resistance levels, an RSI that has not yet reached oversold conditions, and uncertain macroeconomic factors all suggest that Ethereum’s price could face further downside. Investors should be cautious as upcoming events could bring additional volatility to the market.