

SOLANA
- Solana is testing a critical $140 support level amid rising selling pressure and declining bullish interest in its derivatives market, signaling a potential extended correction.
- If the support fails, SOL could drop toward $105, while a recovery faces resistance near the 200-day EMA at $162.
Solana (SOL) is navigating a critical phase amid growing bearish pressure, testing the $140 support zone after a recent sharp decline. Following a nearly 6% drop on Thursday, the cryptocurrency is approaching its second straight bearish weekly close. Technical indicators and derivatives data both suggest that sellers currently dominate the market, with further downside potential looming.
ALSO READ:Why Ethereum Price Is Falling Despite Strong Institutional Interest
Declining Bullish Interest in Solana Derivatives
Recent data from Coinglass reveals a notable drop in Solana’s Open Interest (OI) by 4.61% in the last 24 hours, settling at $6.46 billion. This decline in OI reflects traders’ reduced enthusiasm for maintaining futures or options positions on SOL. As volatility rises, many bullish positions have been liquidated—long liquidations have surged to nearly $47 million, far outpacing the roughly $3.5 million in short liquidations.
The increasing liquidation of longs has shifted market dynamics, pushing the ratio of long to short positions down to 0.9429. This imbalance signals that bearish positions currently outnumber bullish bets in Solana’s derivatives market. Moreover, the OI-weighted funding rate has flipped negative to -0.0083%, indicating that bears are paying bulls to keep perpetual swap prices aligned with the spot price—a sign of bearish dominance.
Technical Outlook Points to Extended Correction
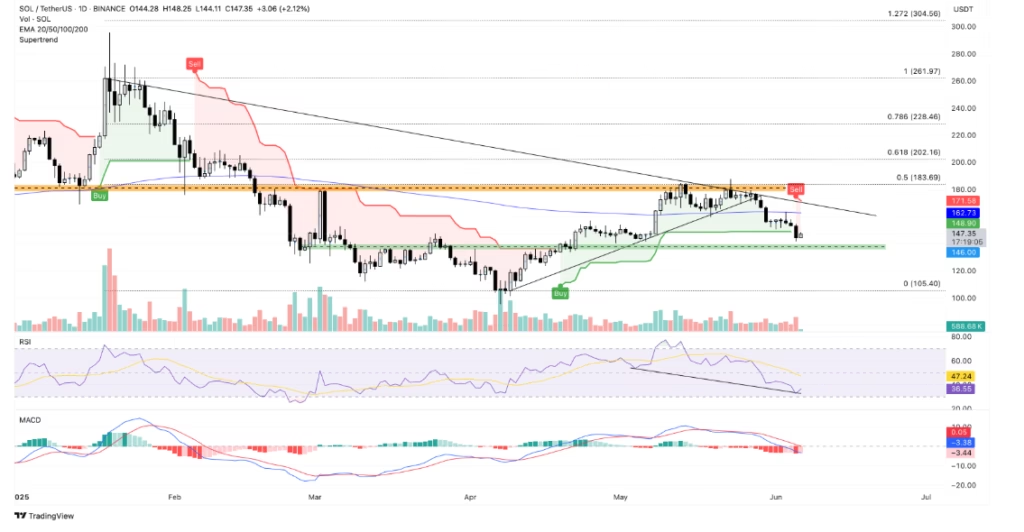
SOL’s price has fallen over 20% from its 30-day high of $187.71 recorded on May 23. Attempts to break above the high supply zone near $180 have failed, reinforced by a persistent multi-month resistance trendline with peaks in January and May. A significant bearish reversal occurred on May 28, breaking below a key short-term support line and completing a triangle pattern that signals continued weakness.
Thursday’s drop pushed Solana below the Supertrend Indicator baseline, triggering a sell signal and reinforcing the bearish trendline near $171. The Relative Strength Index (RSI) now sits at 37, suggesting the asset is not yet oversold but edging toward a potential breakdown below $140. The MACD also turned bearish, with the indicator falling below its centerline and increasing red bars on the histogram.
If SOL fails to hold $140, a deeper correction toward the $105 level—the lowest close this year—may unfold.
Resistance and Recovery Potential
On the upside, any intraday recovery for Solana may face immediate resistance at the 200-day Exponential Moving Average (EMA), currently around $162. Breaking above this level would be crucial for shifting the trend back toward bullish territory.
For now, Solana remains under pressure as selling interest grows and technical signals point to further downside risk. Traders and investors will be watching closely to see if the $140 support holds or if SOL will extend its correction further.
ALSO READ:VeChain Launches Renaissance Update to Revolutionize Its Blockchain
DISCLAIMER:
The views and opinions expressed herein are solely those of the author and do not necessarily reflect the views of the publisher. The publisher does not endorse or guarantee the accuracy of any information presented in this article. Readers are encouraged to conduct further research and consult additional sources before making any decisions based on the content provided.


